

Most sales reports start at the end of the story: how much was invoiced this month. It is the number that reaches the bank, so it gets the attention. But by the time revenue shows up on an invoice, most of the decisions that shaped it were made weeks earlier, and most of the money that was lost along the way is already gone.
Between the first quote and the final invoice, a sale passes through several hands and several systems. Every handoff is a place where value can quietly leak. This article walks through the four stages of the sales journey, the leak at each stage, and the handful of metrics that make those leaks visible.
The four stages of the sales journey
For most B2B companies, a sale follows the same path:
- Quote: a price offer sent to a customer.
- Order: the customer accepts and commits.
- Delivery: the goods or services are supplied, usually with a delivery note.
- Invoice: the customer is billed.
Each stage is usually owned by a different team. Sales owns the quotes, operations owns delivery and finance owns invoicing. That is exactly why the leaks between the stages are so easy to miss: no single report shows the whole path.
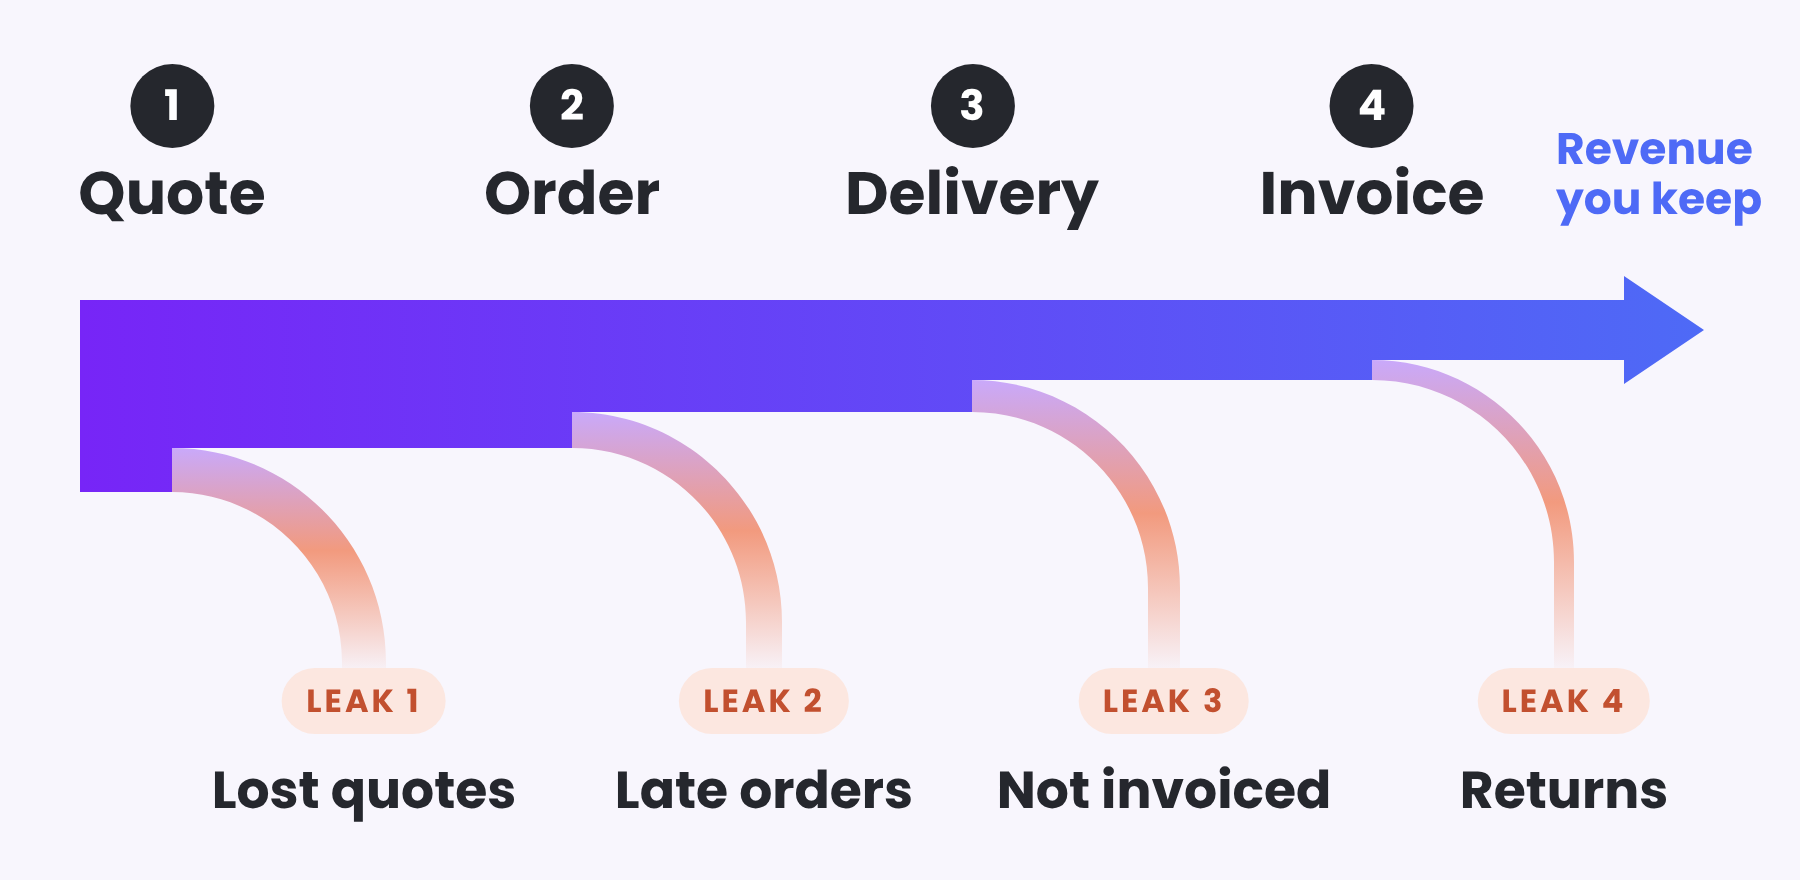
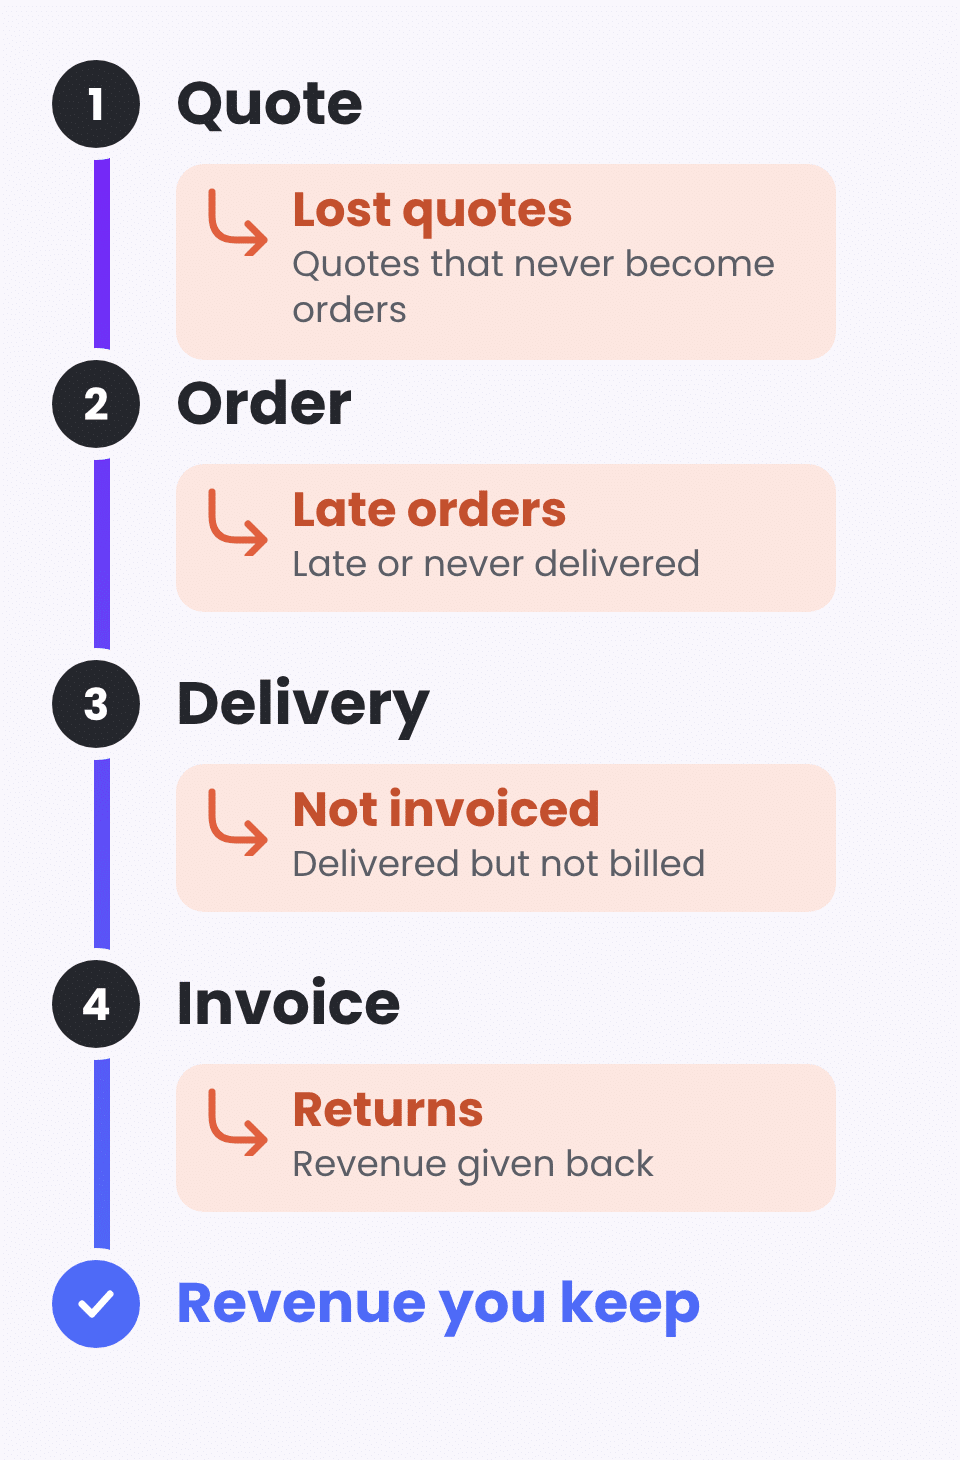
Leak 1: Quotes that never become orders
A quote is the first real sign of demand. When quotes do not convert, the reason can be price, timing, slow follow-up, or quoting the wrong customers in the first place. Three numbers help you tell which:
- Quote conversion rate: the share of quote value that turned into orders.
- Days from quote to order: how long customers take to decide. A rising number often points to slower follow-up.
- Open quotes and their age: every quote that is still waiting, with the number of days since it was sent. Old open quotes are the easiest revenue to recover, because the customer already asked you for a price.
It is also worth watching the opposite case: orders that arrive without a quote. A high share can be perfectly normal for repeat customers, but it can also mean that pricing decisions are being made outside the process.
Leak 2: Orders that are late or never delivered
An order is a promise. When it is delivered late, the customer remembers. When part of it is never delivered, the revenue never arrives. Track:
- Delivered share of orders: how much of the ordered value has actually been supplied.
- On-time delivery rate: how much was delivered by the promised date.
- Open and overdue orders: every order that is still waiting, its due date and how many days it is late.
This is the stage where companies are most often surprised. A business can convert quotes well and still deliver most of its orders late, and the invoice report will never show it.
Leak 3: Delivered, but not yet invoiced
Goods that left the warehouse without an invoice are revenue you have earned but cannot collect. Sometimes it is a timing gap of a few days. Sometimes it is a delivery note that was simply forgotten. Either way, it sits between operations and finance, where nobody really owns it.
- Invoiced share of deliveries: how much of what was supplied has already been billed.
- Value awaiting invoice: the amount that was delivered and is still waiting to be billed. This single number often pays for the whole exercise, because it goes straight to cash flow.
Leak 4: Returns that eat into profit
The journey does not end at the invoice. Returns reduce both revenue and profit, and they usually point to a problem earlier on: the wrong product, a quality issue, or an order that should not have been taken. Measure the return rate and, even more importantly, the profit impact of returns, broken down by product, category and supplier.
What it looks like when you see the whole path
Here is what it can look like in a typical month for a B2B distributor:
- 78% of quote value turned into orders, in 12 days on average.
- 82% of ordered value was delivered, but only 22% of it on time.
- 93% of deliveries were invoiced, with 32K still waiting for an invoice.
A company looking only at its invoices would see a healthy month. Looking at the whole journey, it sees a delivery problem that will eventually cost it customers, and an invoicing gap that is worth chasing this week.
Two details that make the numbers trustworthy
Use the last date in the data, not today. If your data is refreshed once a day or once a week, a “this month” view measured from today’s date will always look incomplete. Anchoring the report to the last sales date in the data keeps the current month and current year views honest.
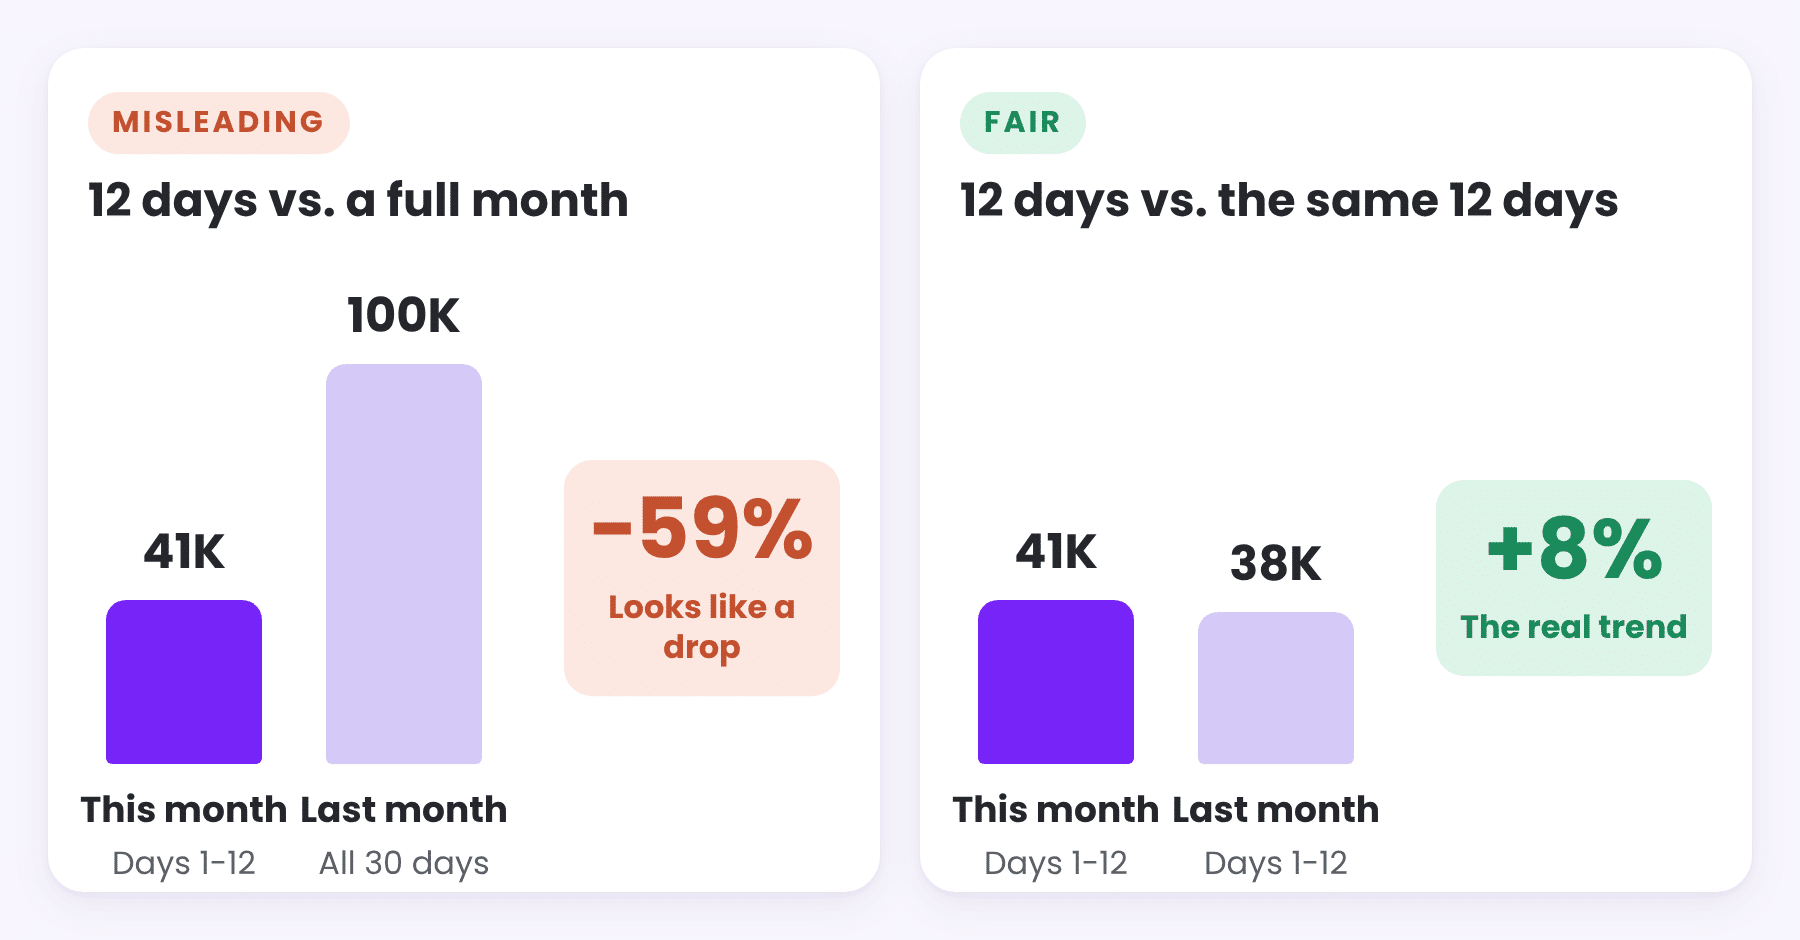
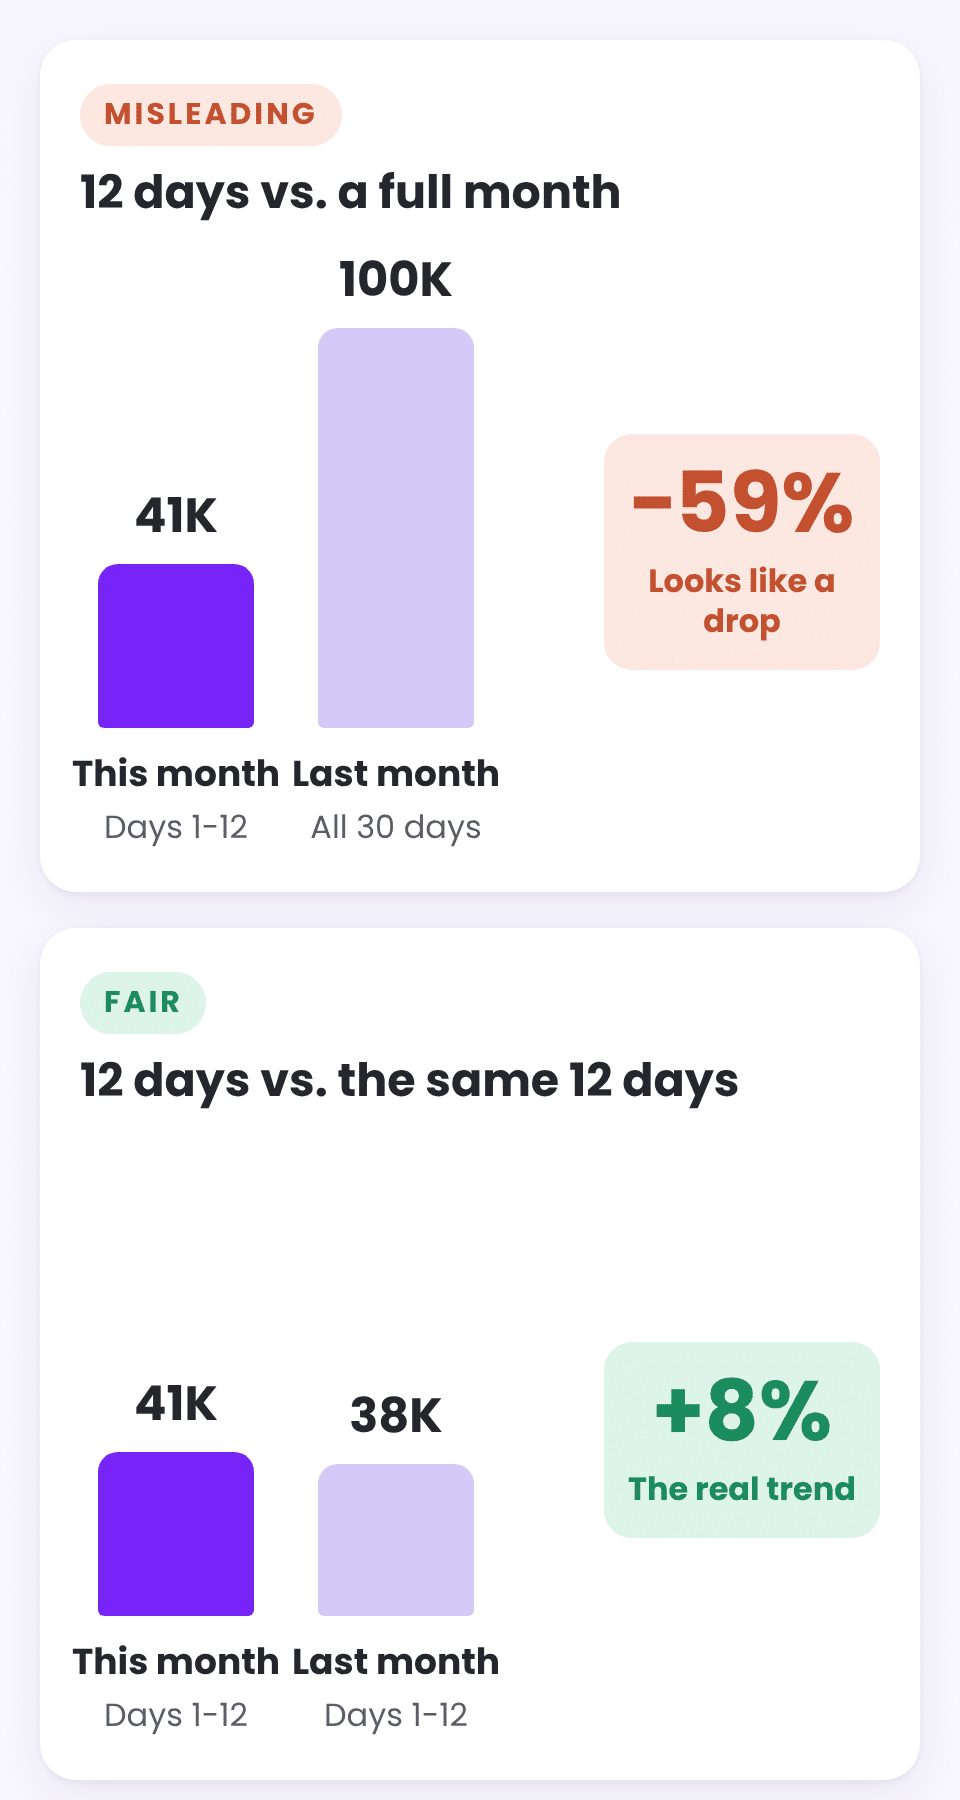
Compare like with like. Comparing the first 12 days of this month with the whole of last month makes every month look like a decline. A fair comparison uses the same number of days in both periods, whether you compare with last year or with the previous month.
A checklist for your own sales journey
| Stage | What to measure | What it tells you |
|---|---|---|
| Quote to order | Conversion rate, days to order, open quotes by age | Whether demand turns into commitment |
| Order to delivery | Delivered share, on-time rate, overdue orders | Whether you keep your promises |
| Delivery to invoice | Invoiced share, value awaiting invoice | Whether earned revenue becomes cash |
| After the invoice | Return rate, profit impact of returns | Whether the sale was worth making |
Want to see how a report can guide people along a path like this, from the overview down to a single order? Read From Dashboards to Analysis Systems: What Power BI Can Do Today.
Keep reading
From the BistarData shop
How we turned this into a dashboard
We built Sales Journey: Quote to Invoice around the checklist above. It follows every sale from the first quote to the final invoice, including returns, across four pages: Overview, Sales, Quotes and Orders, and Returns.
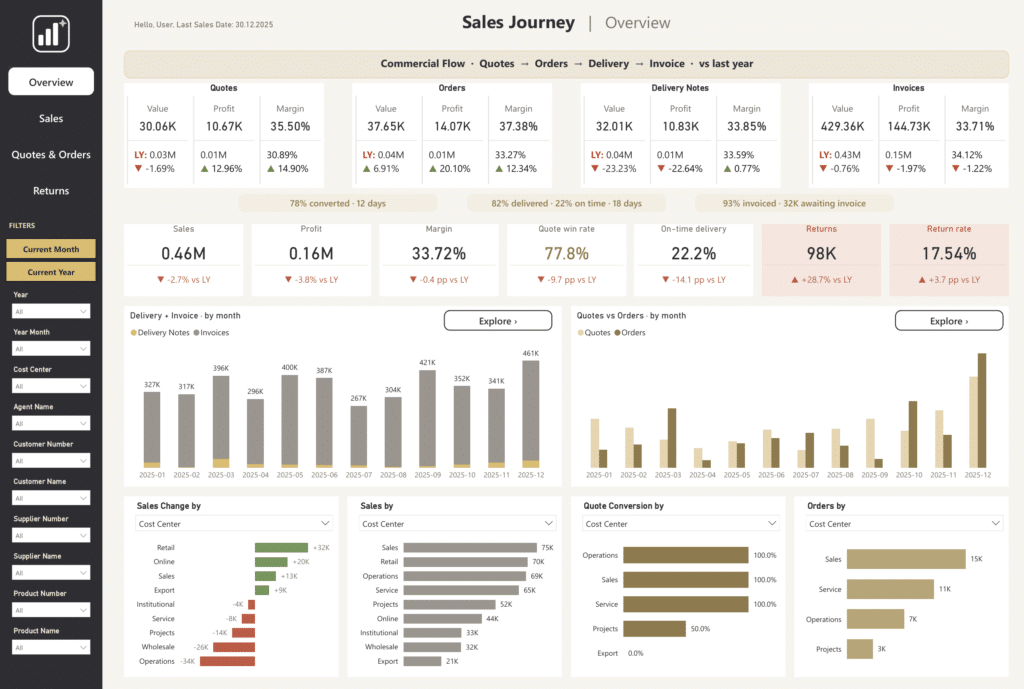
- Conversion between every stage of the journey, with value, gross profit and margin at each stage
- Open, overdue and unconverted orders and quotes, with the number of days each one has been waiting
- Current month and current year views, compared with last year or with the previous month
- A breakdown by cost center, agent, category or supplier, with drill-down to the product level
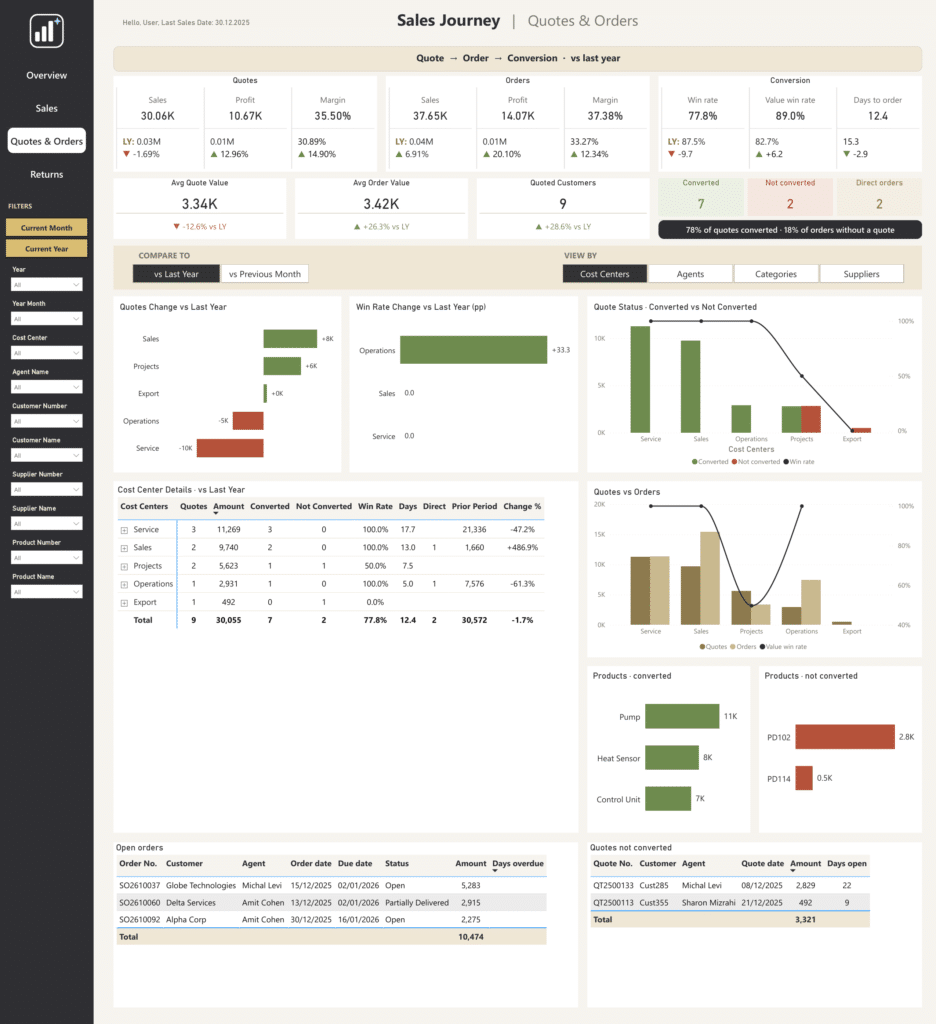
It connects to Excel or SQL Server with a single parameter, and comes with a SQL views script for your own database, a sample data workbook and a PDF guide with every KPI definition. Click through the real report with sample data before you decide.