

Most sales leaderboards rank agents by how much they sold. It is simple, and it is usually unfair. The agent with the biggest territory tops the list every month, a new agent looks weak no matter how hard they work, and on the 15th of the month nobody can tell whether the team is going to make it.
A fair scorecard answers three different questions: who is on target, who is on pace to get there, and what can still close the gap. Here is how to measure each one.
Start with the target, not the total
Sales against a monthly target puts every agent on the same scale. An agent who sold 80K against a 70K target is doing better than one who sold 120K against 150K, even though a simple ranking says the opposite. Show both sides of it:
- Achievement %: sales as a share of the target.
- Gap to target: the amount still missing, in money.
- Team rank: by achievement, not by total sales.
Targets also make months comparable. A December target can be higher than an August one, so every agent is measured against what was expected in that month, not against a flat average.
Pace: will they make it by month end?
Halfway through the month, the actual number alone says very little. What matters is the pace. Two measures turn the scorecard from a report about the past into a tool for the rest of the month:
- Month-end forecast: sales so far, extended at the current daily rate to the end of the month.
- Required sales per day: what is still missing, divided by the selling days that are left.
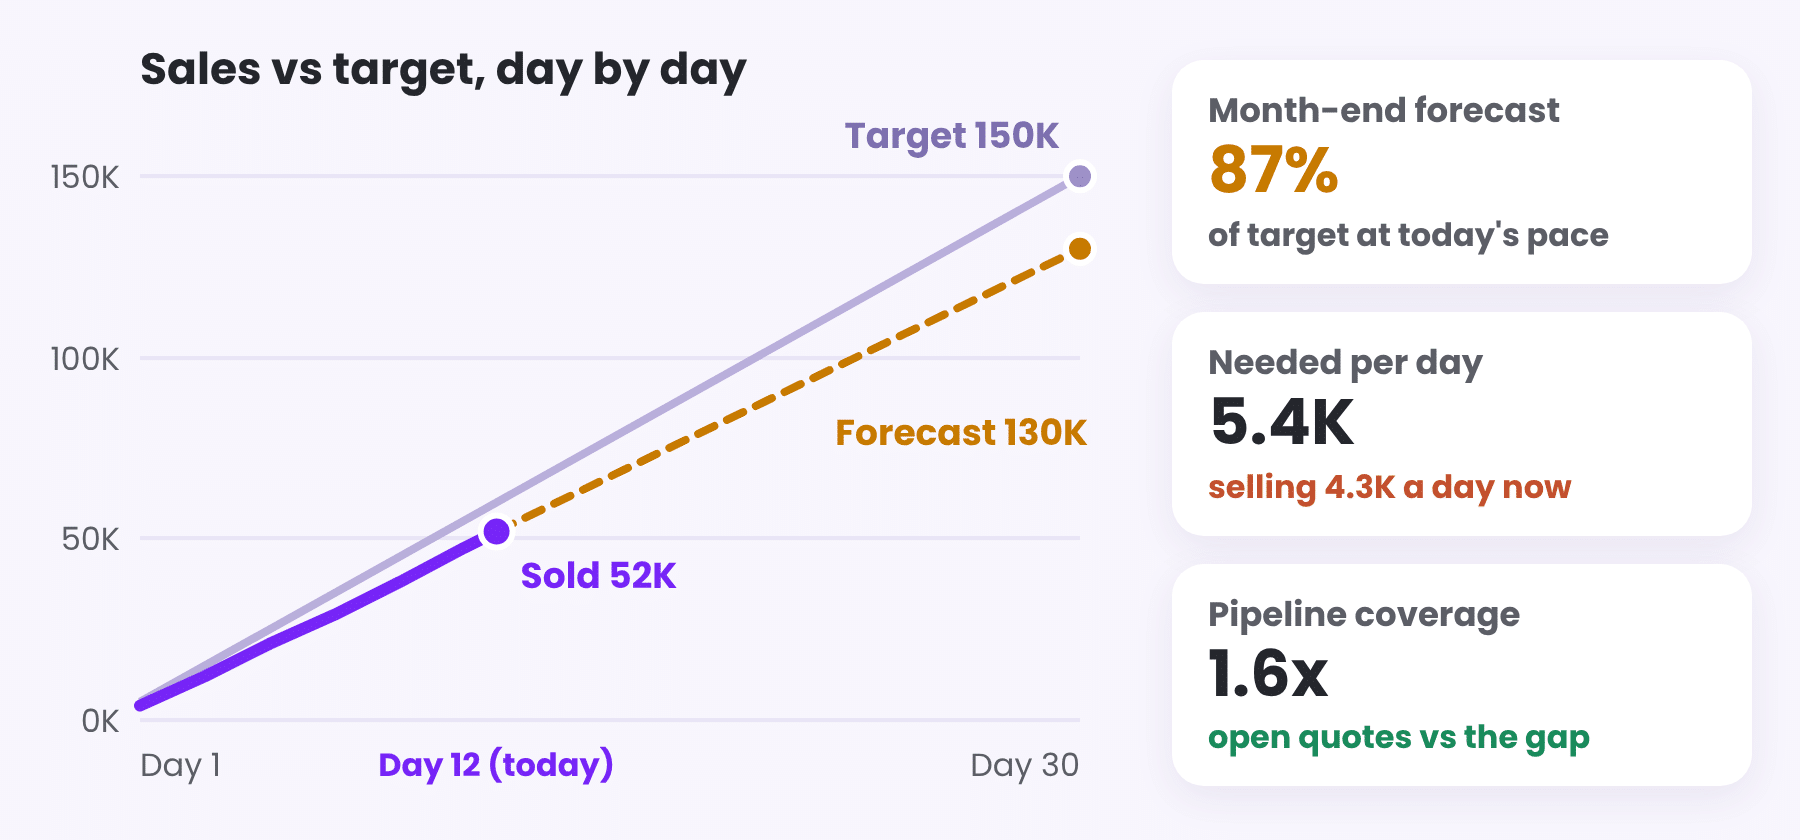
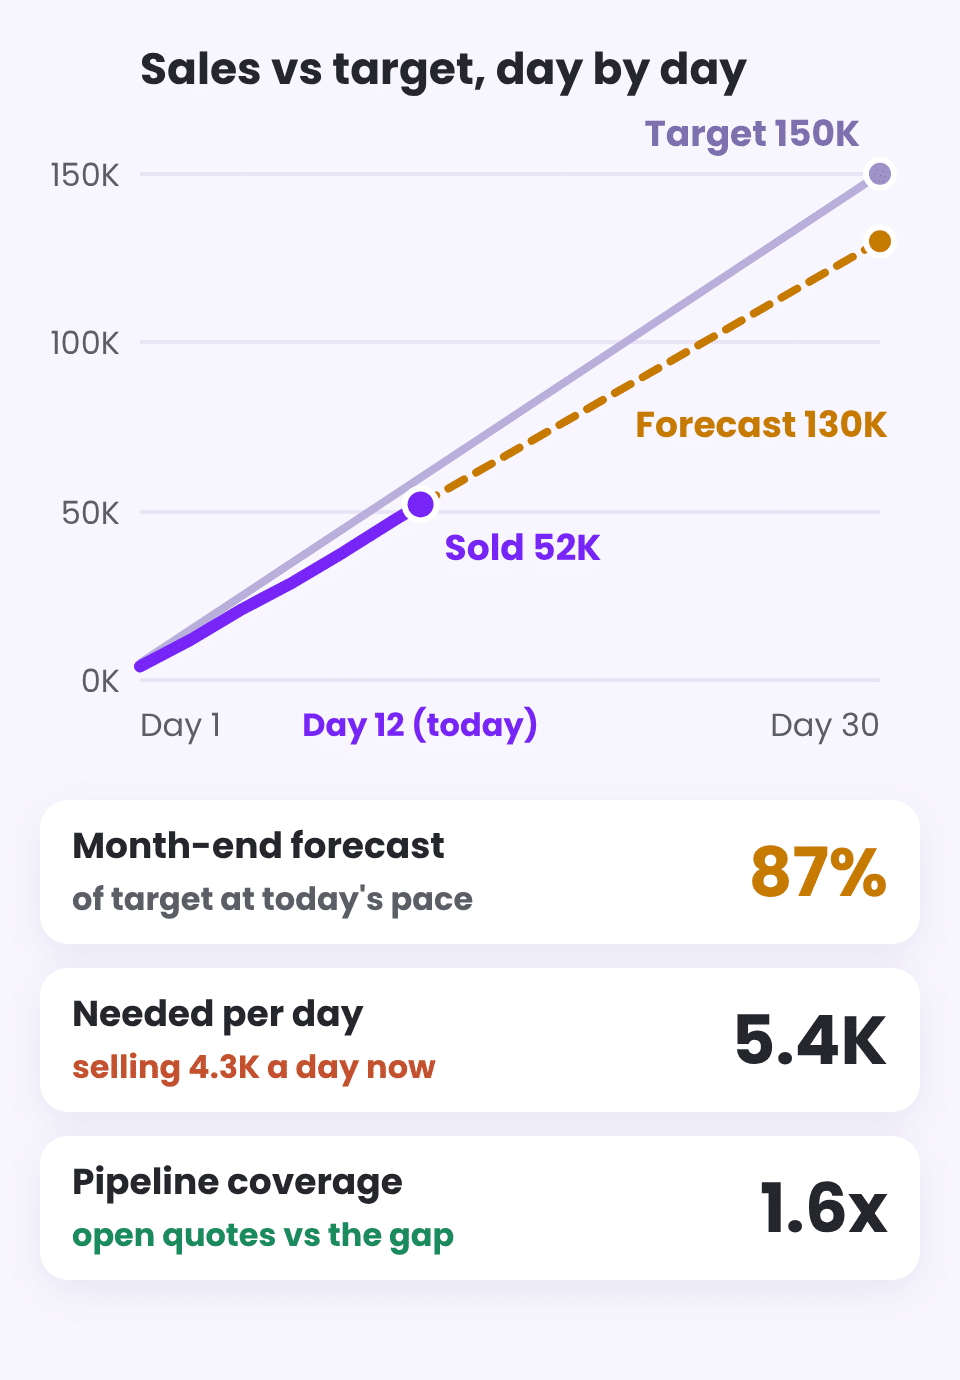
When the required daily rate is well above what an agent has been selling, the conversation can happen on the 12th of the month, while there is still time to act, instead of after the target has been missed.
Pipeline: can open quotes close the gap?
The next question is whether the gap can be closed at all. Compare each agent’s open quotes with the part of the target that is still missing. Pipeline coverage of 2x means there are open quotes worth twice the gap. A ratio of 1x leaves no room for lost deals, and anything below that means the target will not be reached without new opportunities.
Win rate and days from quote to order complete the picture. An agent with a large pipeline and a low win rate is in a very different place than one with a small pipeline who closes most of it. We look at the whole path from quote to invoice in Where Sales Leak Between the Quote and the Invoice.
Count returns against the sale
A sale that comes back next month is not really a sale. If returns are ignored, the scorecard rewards volume that later disappears. Show achievement both before and after returns, and track the return rate by agent, so that pushing the wrong product to the wrong customer does not look like success.
Keep quotes and sales on separate pages
Some companies measure agents on quotes as well as on sales, and that is fine. Mixing the two in one chart is not: a quote is a promise of a future sale, not a sale, and adding them together counts the same deal twice. Keep the pipeline on its own page, and keep the scorecard itself about sales against target.
Compare fairly over time
Compare each agent with their target, with the same month last year or with the previous month, and always on the same number of days. Comparing the first ten days of this month with the whole of last month makes everyone look like they are falling behind. More on this in Month to Date, Year to Date and Last Year: Getting Period Comparisons Right.
A scorecard checklist
| Question | What to measure |
|---|---|
| Who is on target? | Achievement % and gap to target |
| Who will make it? | Month-end forecast and required sales per day |
| Can the gap be closed? | Pipeline coverage, win rate, days to order |
| Is the achievement real? | Achievement after returns, return rate |
| Is it improving? | Monthly actual vs target, best and weakest month |
Keep reading
From the BistarData shop
A scorecard built around targets
Sales Team Scorecard measures every agent against a monthly target and looks ahead to the end of the month:
- Agent scorecard with month-end forecast and required sales per day
- Pipeline coverage, win rate and days from quote to order
- Target achievement after returns, and return rate by agent
- Monthly achievement heat map by agent
- Compare to target, last year or the previous month