

Most companies know their top ten customers by name. Very few know which of their good customers quietly stopped buying three months ago. RFM is a simple, proven way to see both, using only the sales data you already have.
What RFM measures
- Recency: how long it has been since the customer last bought.
- Frequency: how often they buy.
- Monetary: how much they spend.
Each customer gets a score from 1 to 5 on each of the three. Together they describe the relationship better than total sales alone. A customer who spent a lot two years ago and nothing since is not a top customer anymore, even if their lifetime total is high.
Score customers relative to each other
The most robust way to score is to rank all customers on each measure and split them into five equal groups. Relative scoring means there is no need to decide in advance what “frequent” or “big” means. The same logic works for a business with 200 customers and for one with 20,000, and it adjusts by itself as the business grows.
From scores to segments people understand
Nobody acts on “a 3-4-5 customer”. Map the scores to a handful of business segments, each with a clear meaning and a clear next step:
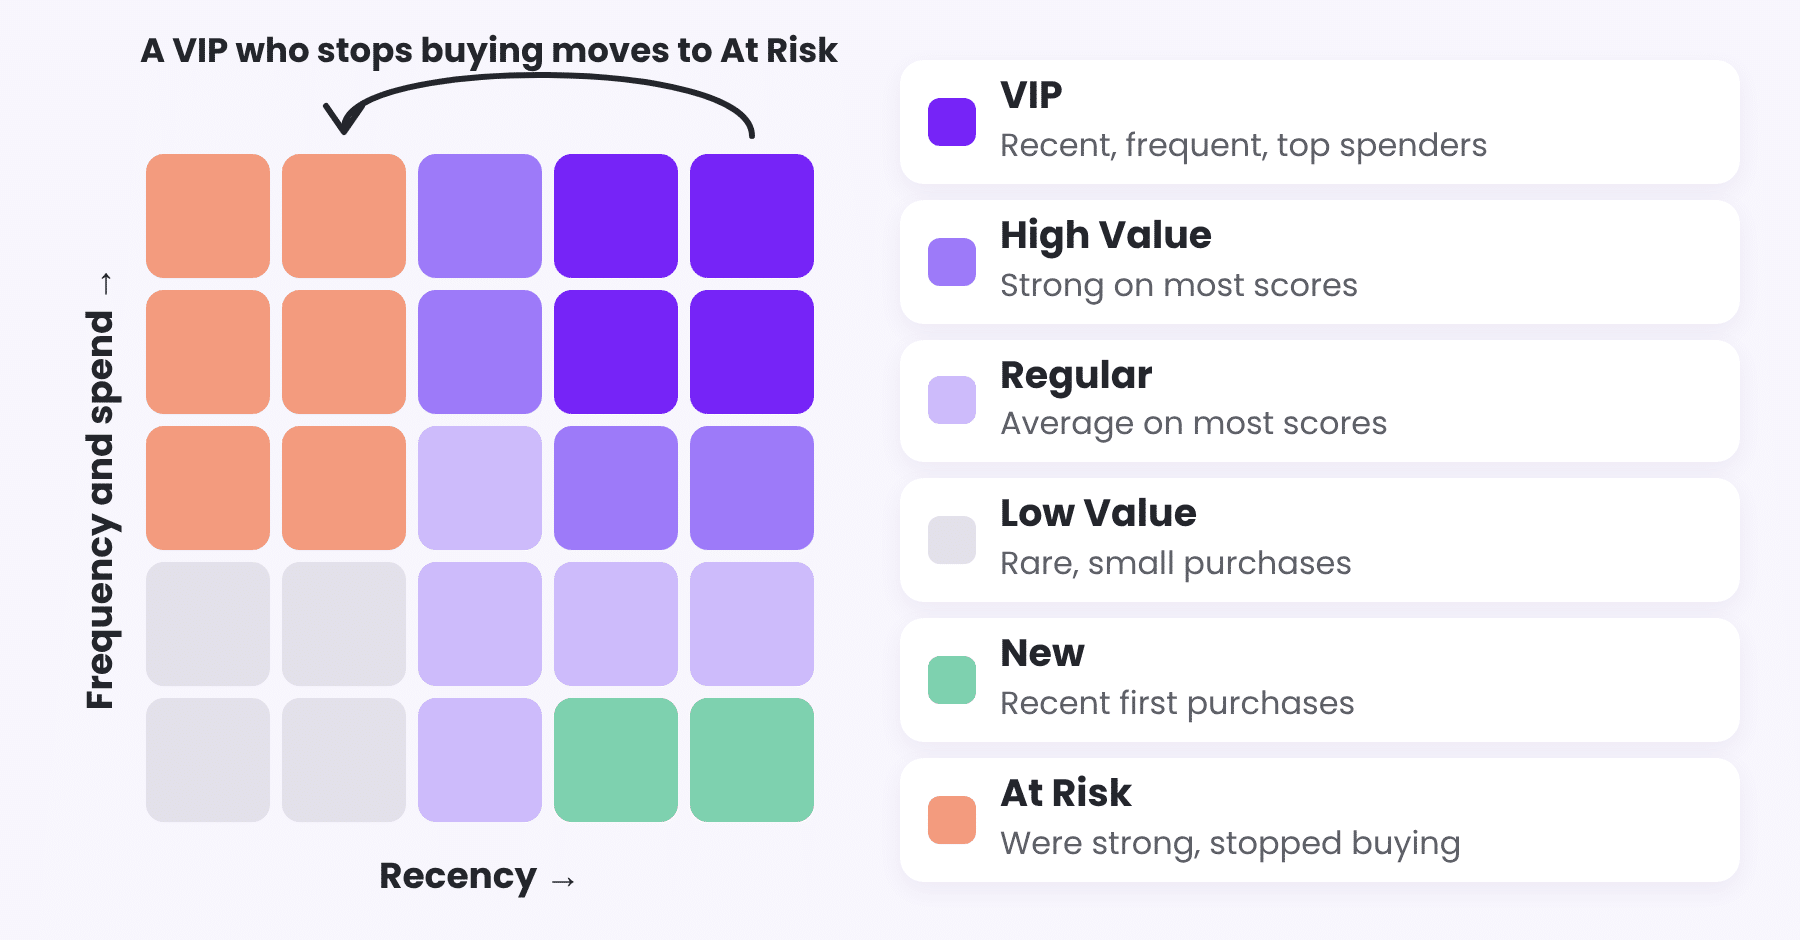
| Segment | Who they are | What to do |
|---|---|---|
| VIP | Bought recently, buy often, spend the most | Protect: personal attention, early access |
| High Value | Strong on most scores | Grow: offer more of what they already buy |
| Regular | Average on most scores | Keep them engaged with regular contact |
| Low Value | Rare, small purchases | Serve efficiently, at low cost |
| New | First purchases in the recent period | Turn the first order into a second one |
| At Risk | Used to be strong, but stopped buying | Call now, before they are gone |
Watch the movement, not just the segment
The most valuable signal is a change. A VIP who becomes At Risk is worth a phone call today. Keep each customer’s previous segment, show who moved down this period, and put a number on it: the sales at risk from customers in the At Risk segment. That is a figure management pays attention to.
Retention and time between purchases
Two more measures complete the picture. The retention rate shows what share of last period’s customers bought again. The typical time between purchases shows each customer’s normal rhythm. When a customer goes well past their usual interval, it is an early warning, often before the RFM score itself drops.
One click to the full story
Segments tell you who to look at. A Customer 360 page tells you what to say: purchase history, lifetime value, favourite products and categories, and how this year compares with last year. The best way to reach it is by drill through from any chart, as described in From Dashboards to Analysis Systems: What Power BI Can Do Today.
Keep reading
From the BistarData shop
Customer segmentation, ready to use
Customer Compass scores every customer with RFM and places them in one business segment:
- RFM scores for every customer, relative to all other customers
- Six segments: VIP, High Value, Regular, Low Value, At Risk and New
- At Risk customer list and sales at risk
- Retention, repeat purchase rate and time between purchases
- Customer 360 by drill through from every page