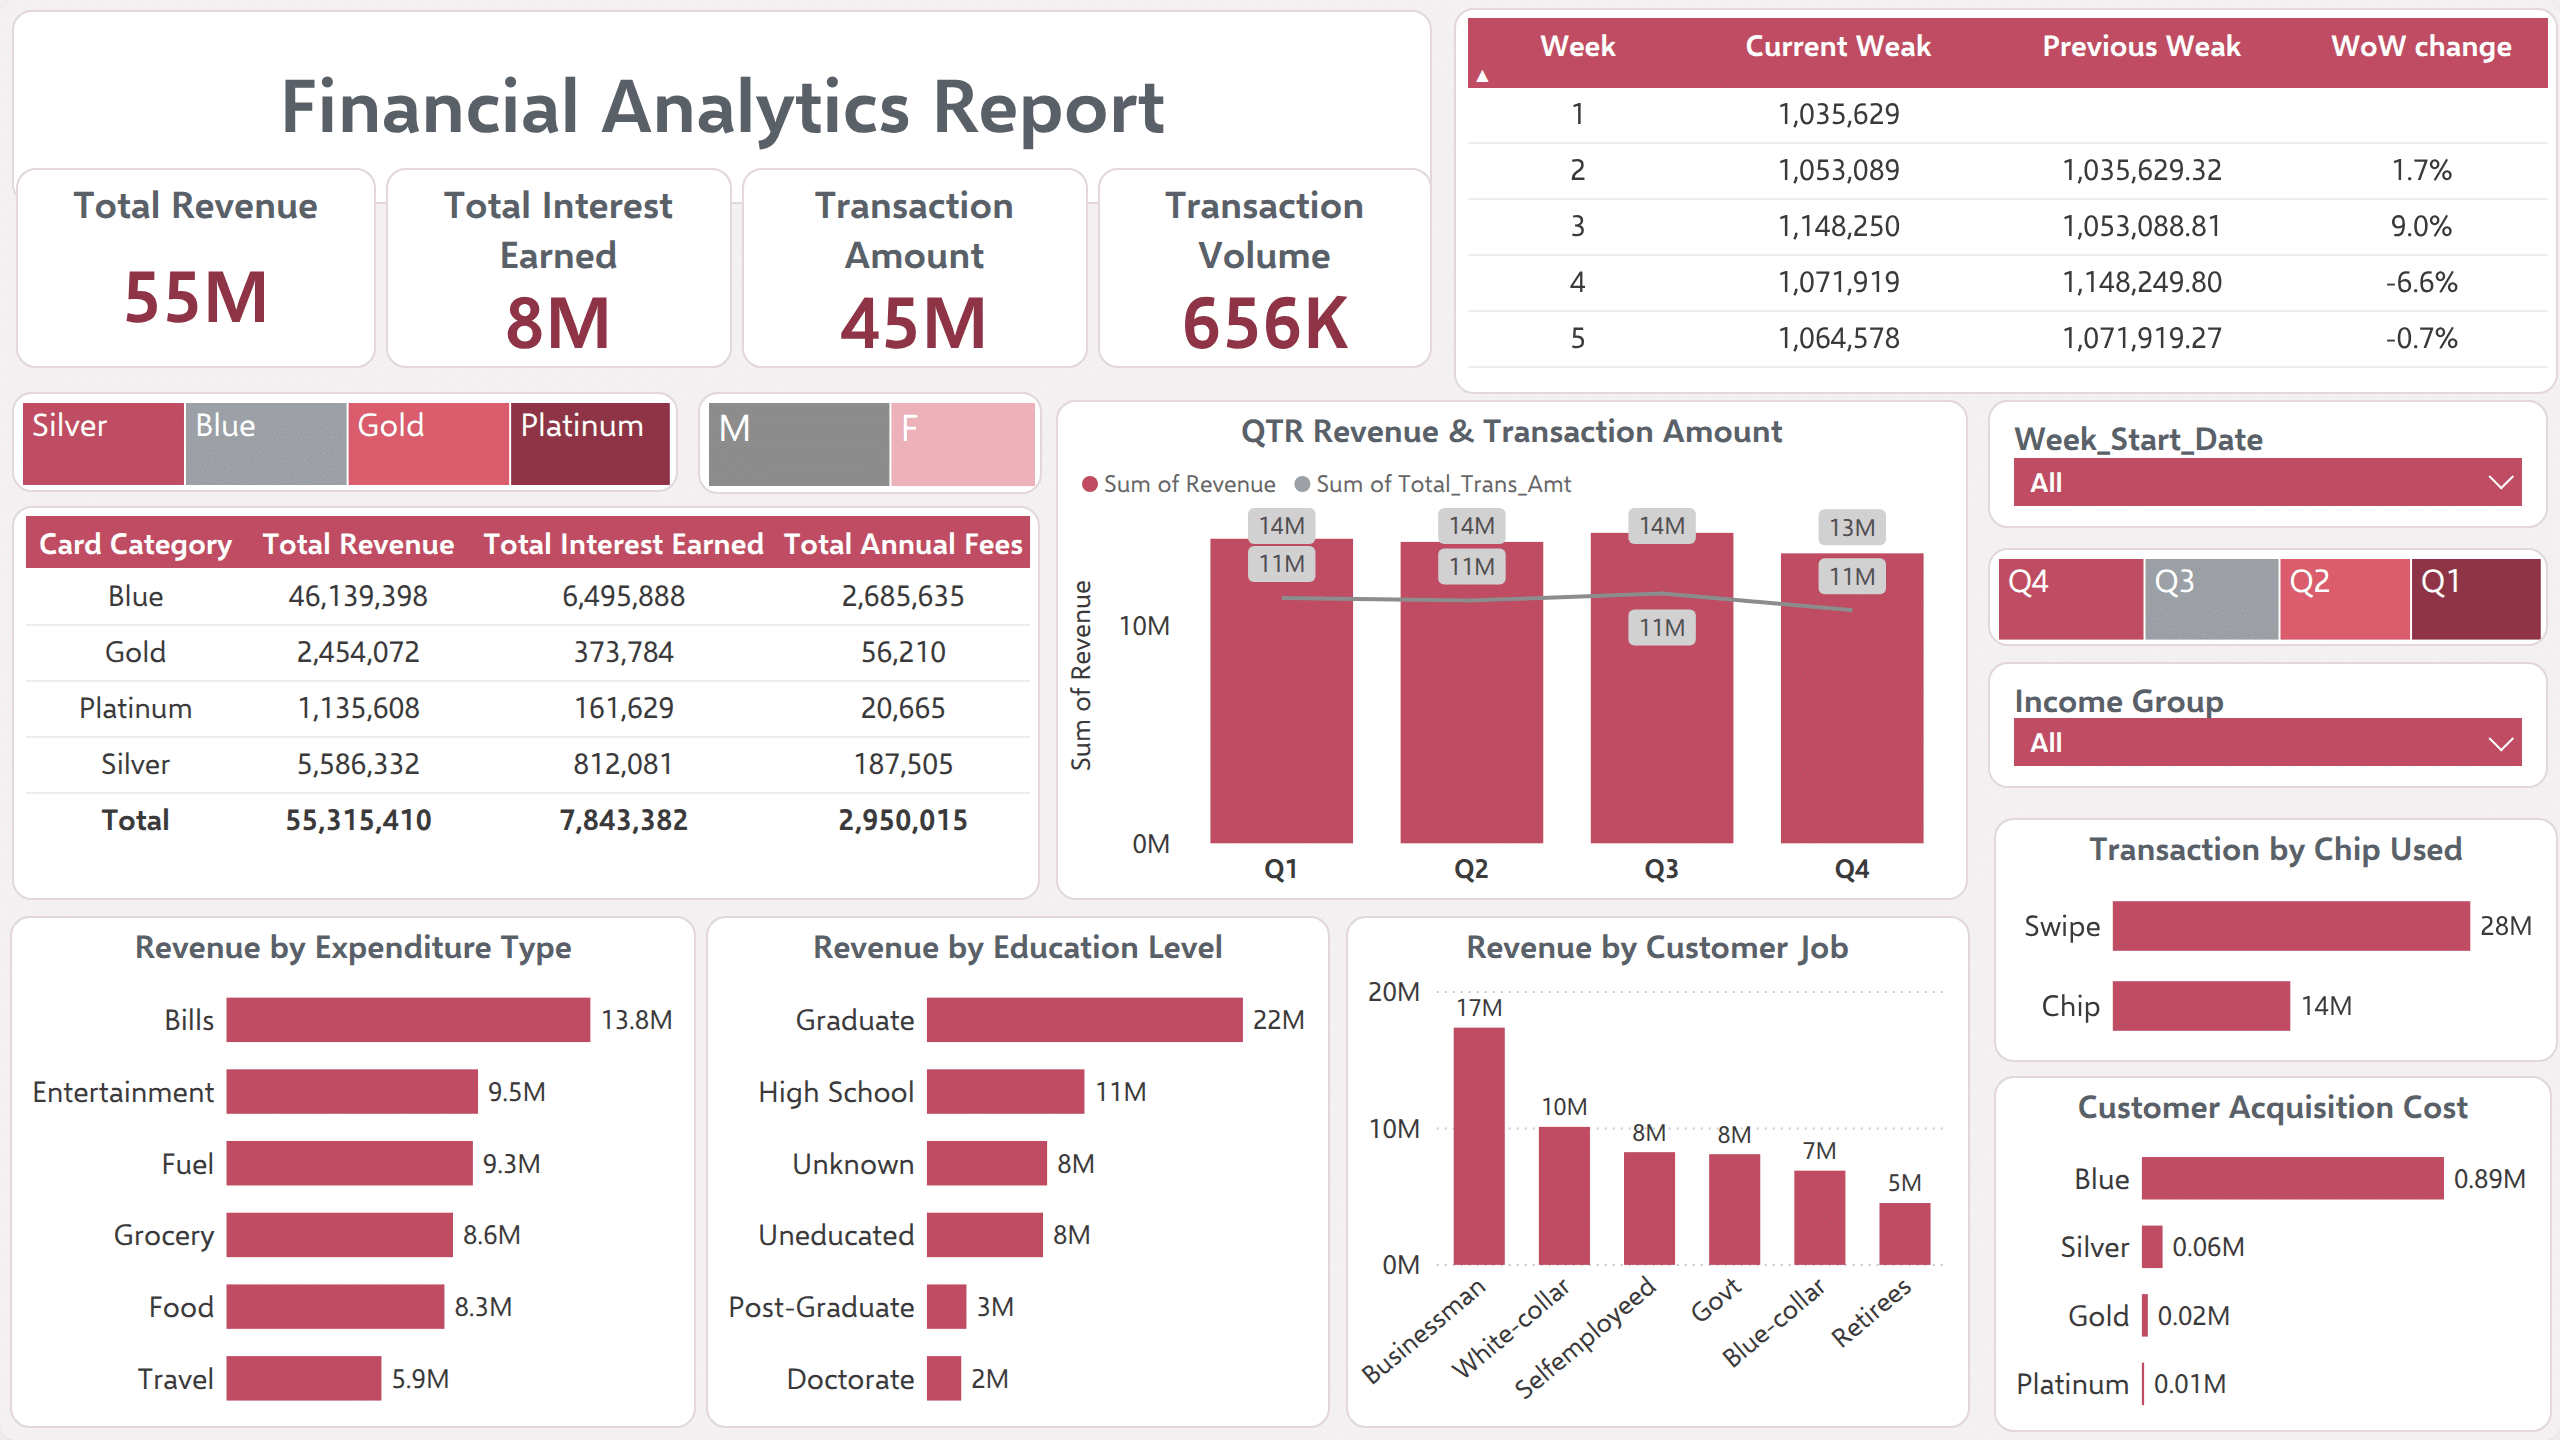
The ChallengeRevenue, interest and transactions are tracked in different places.
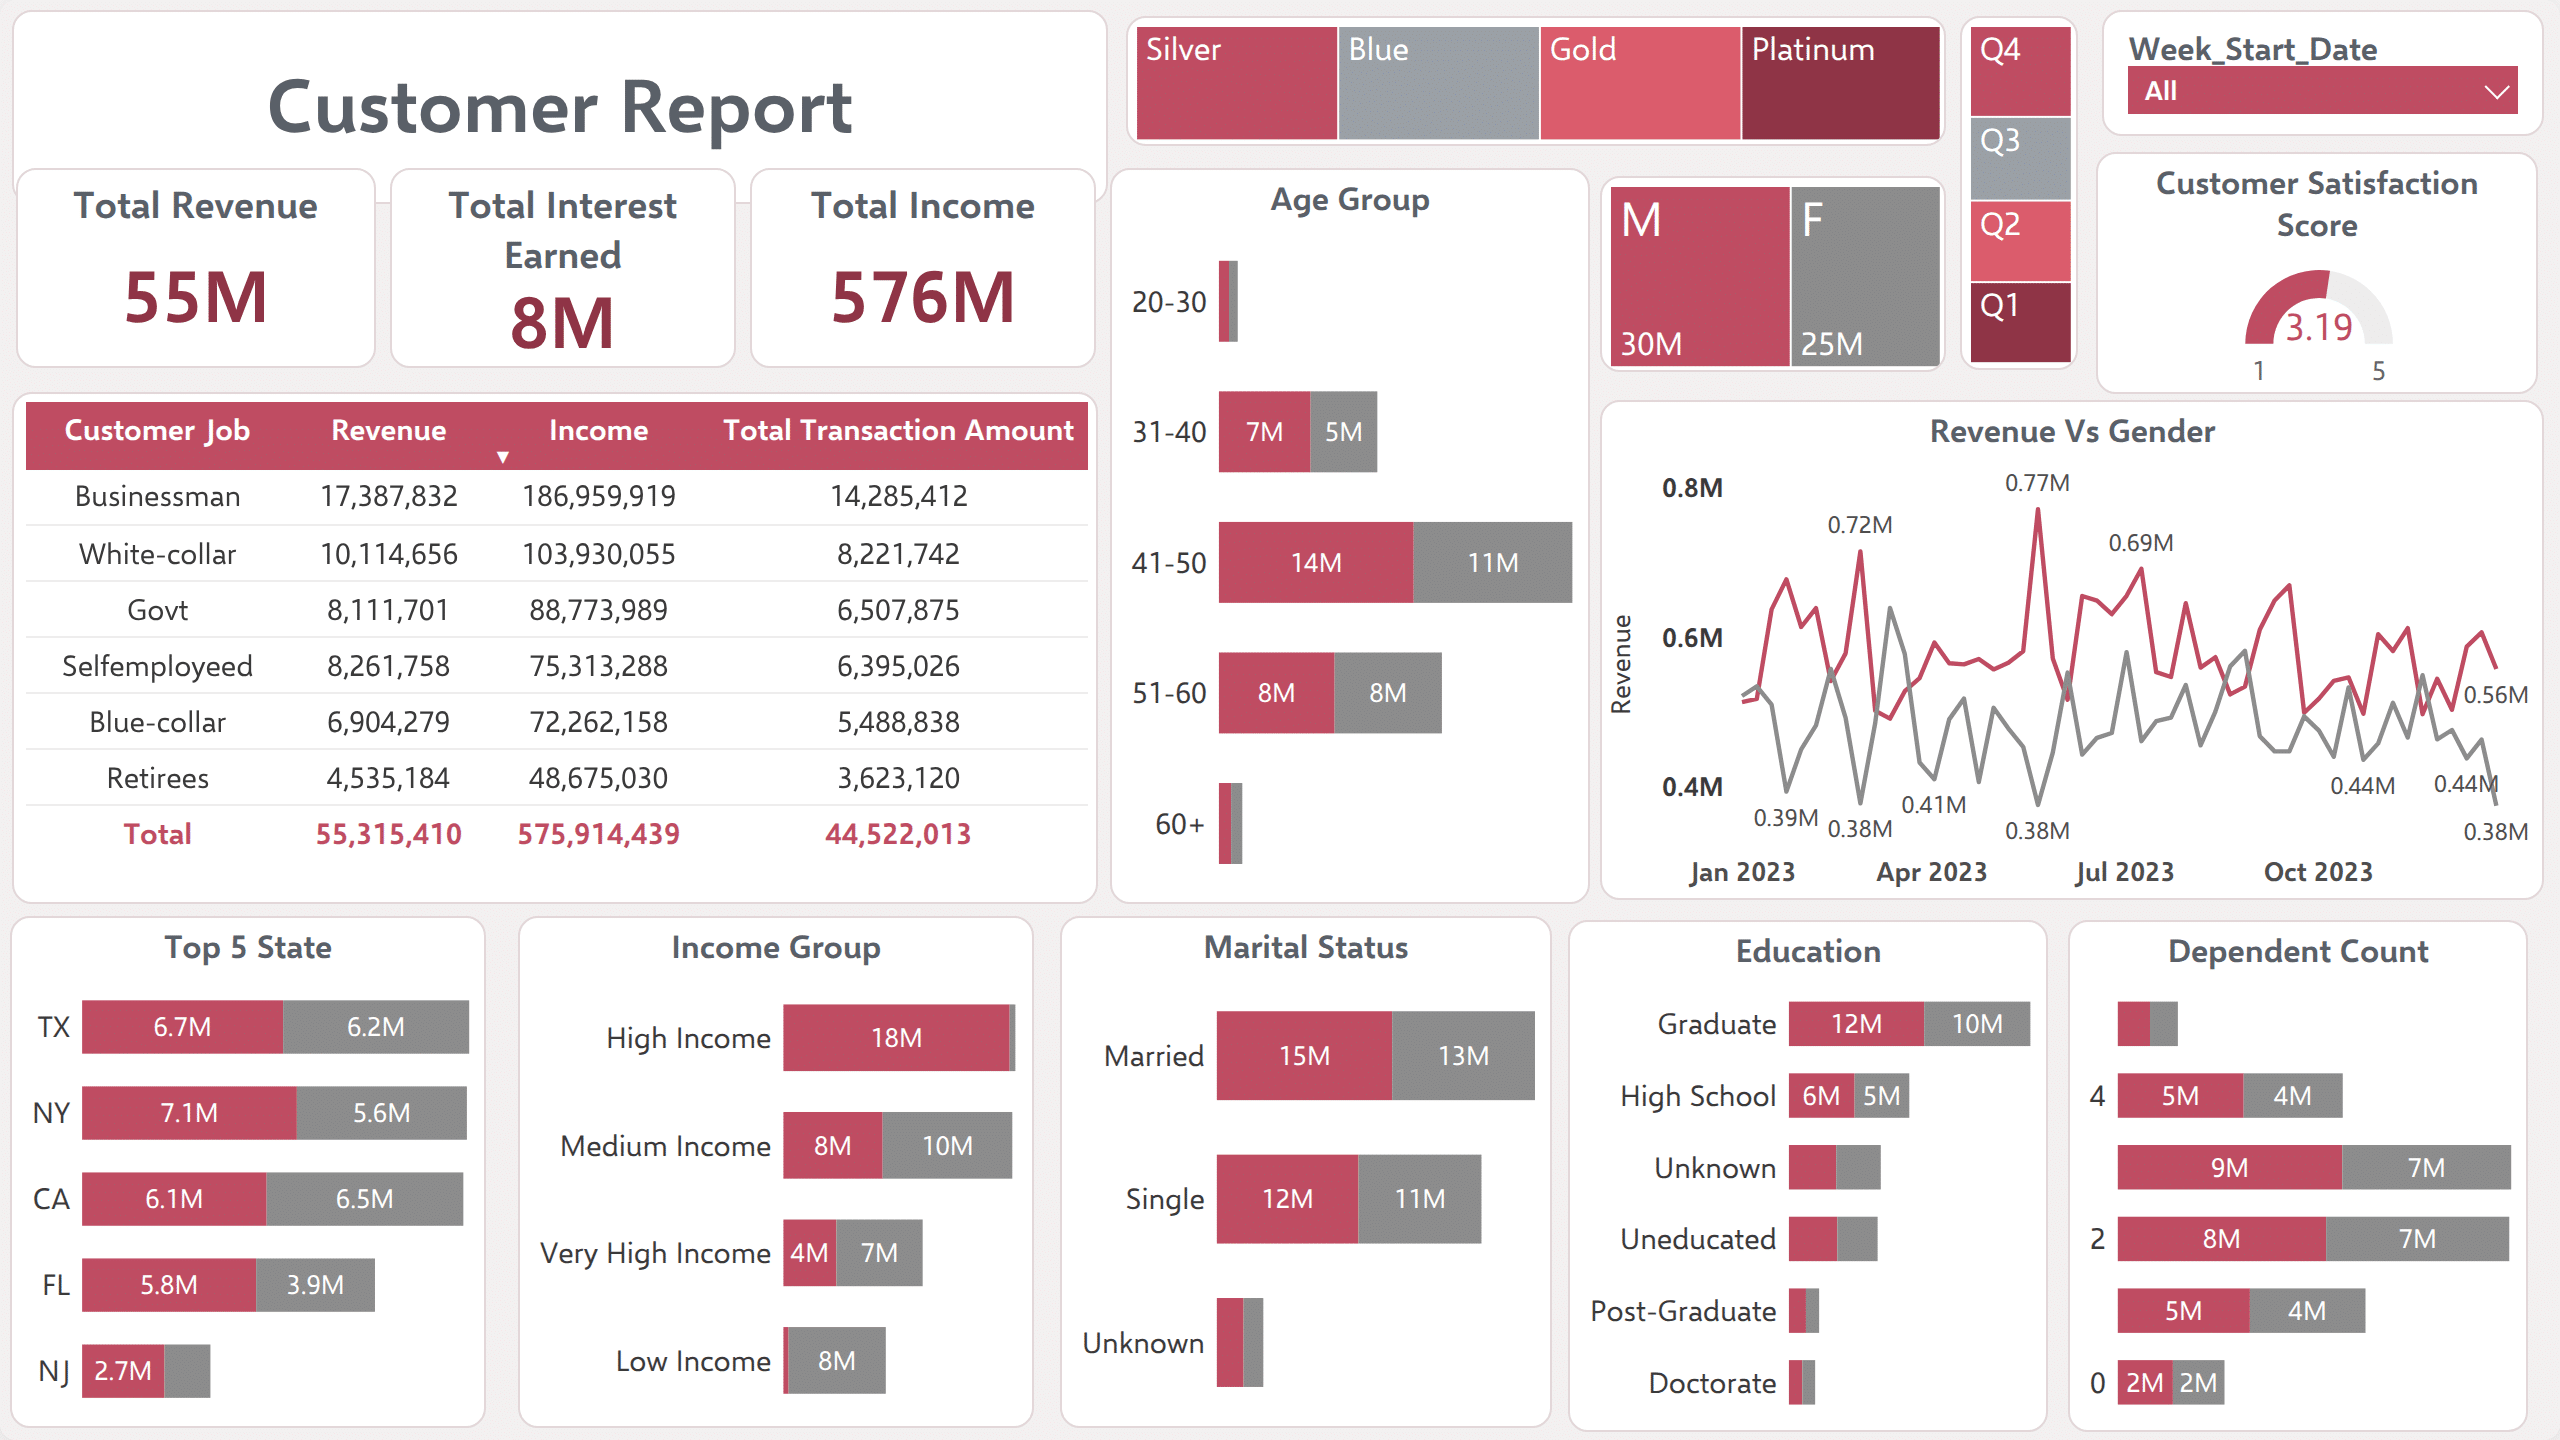
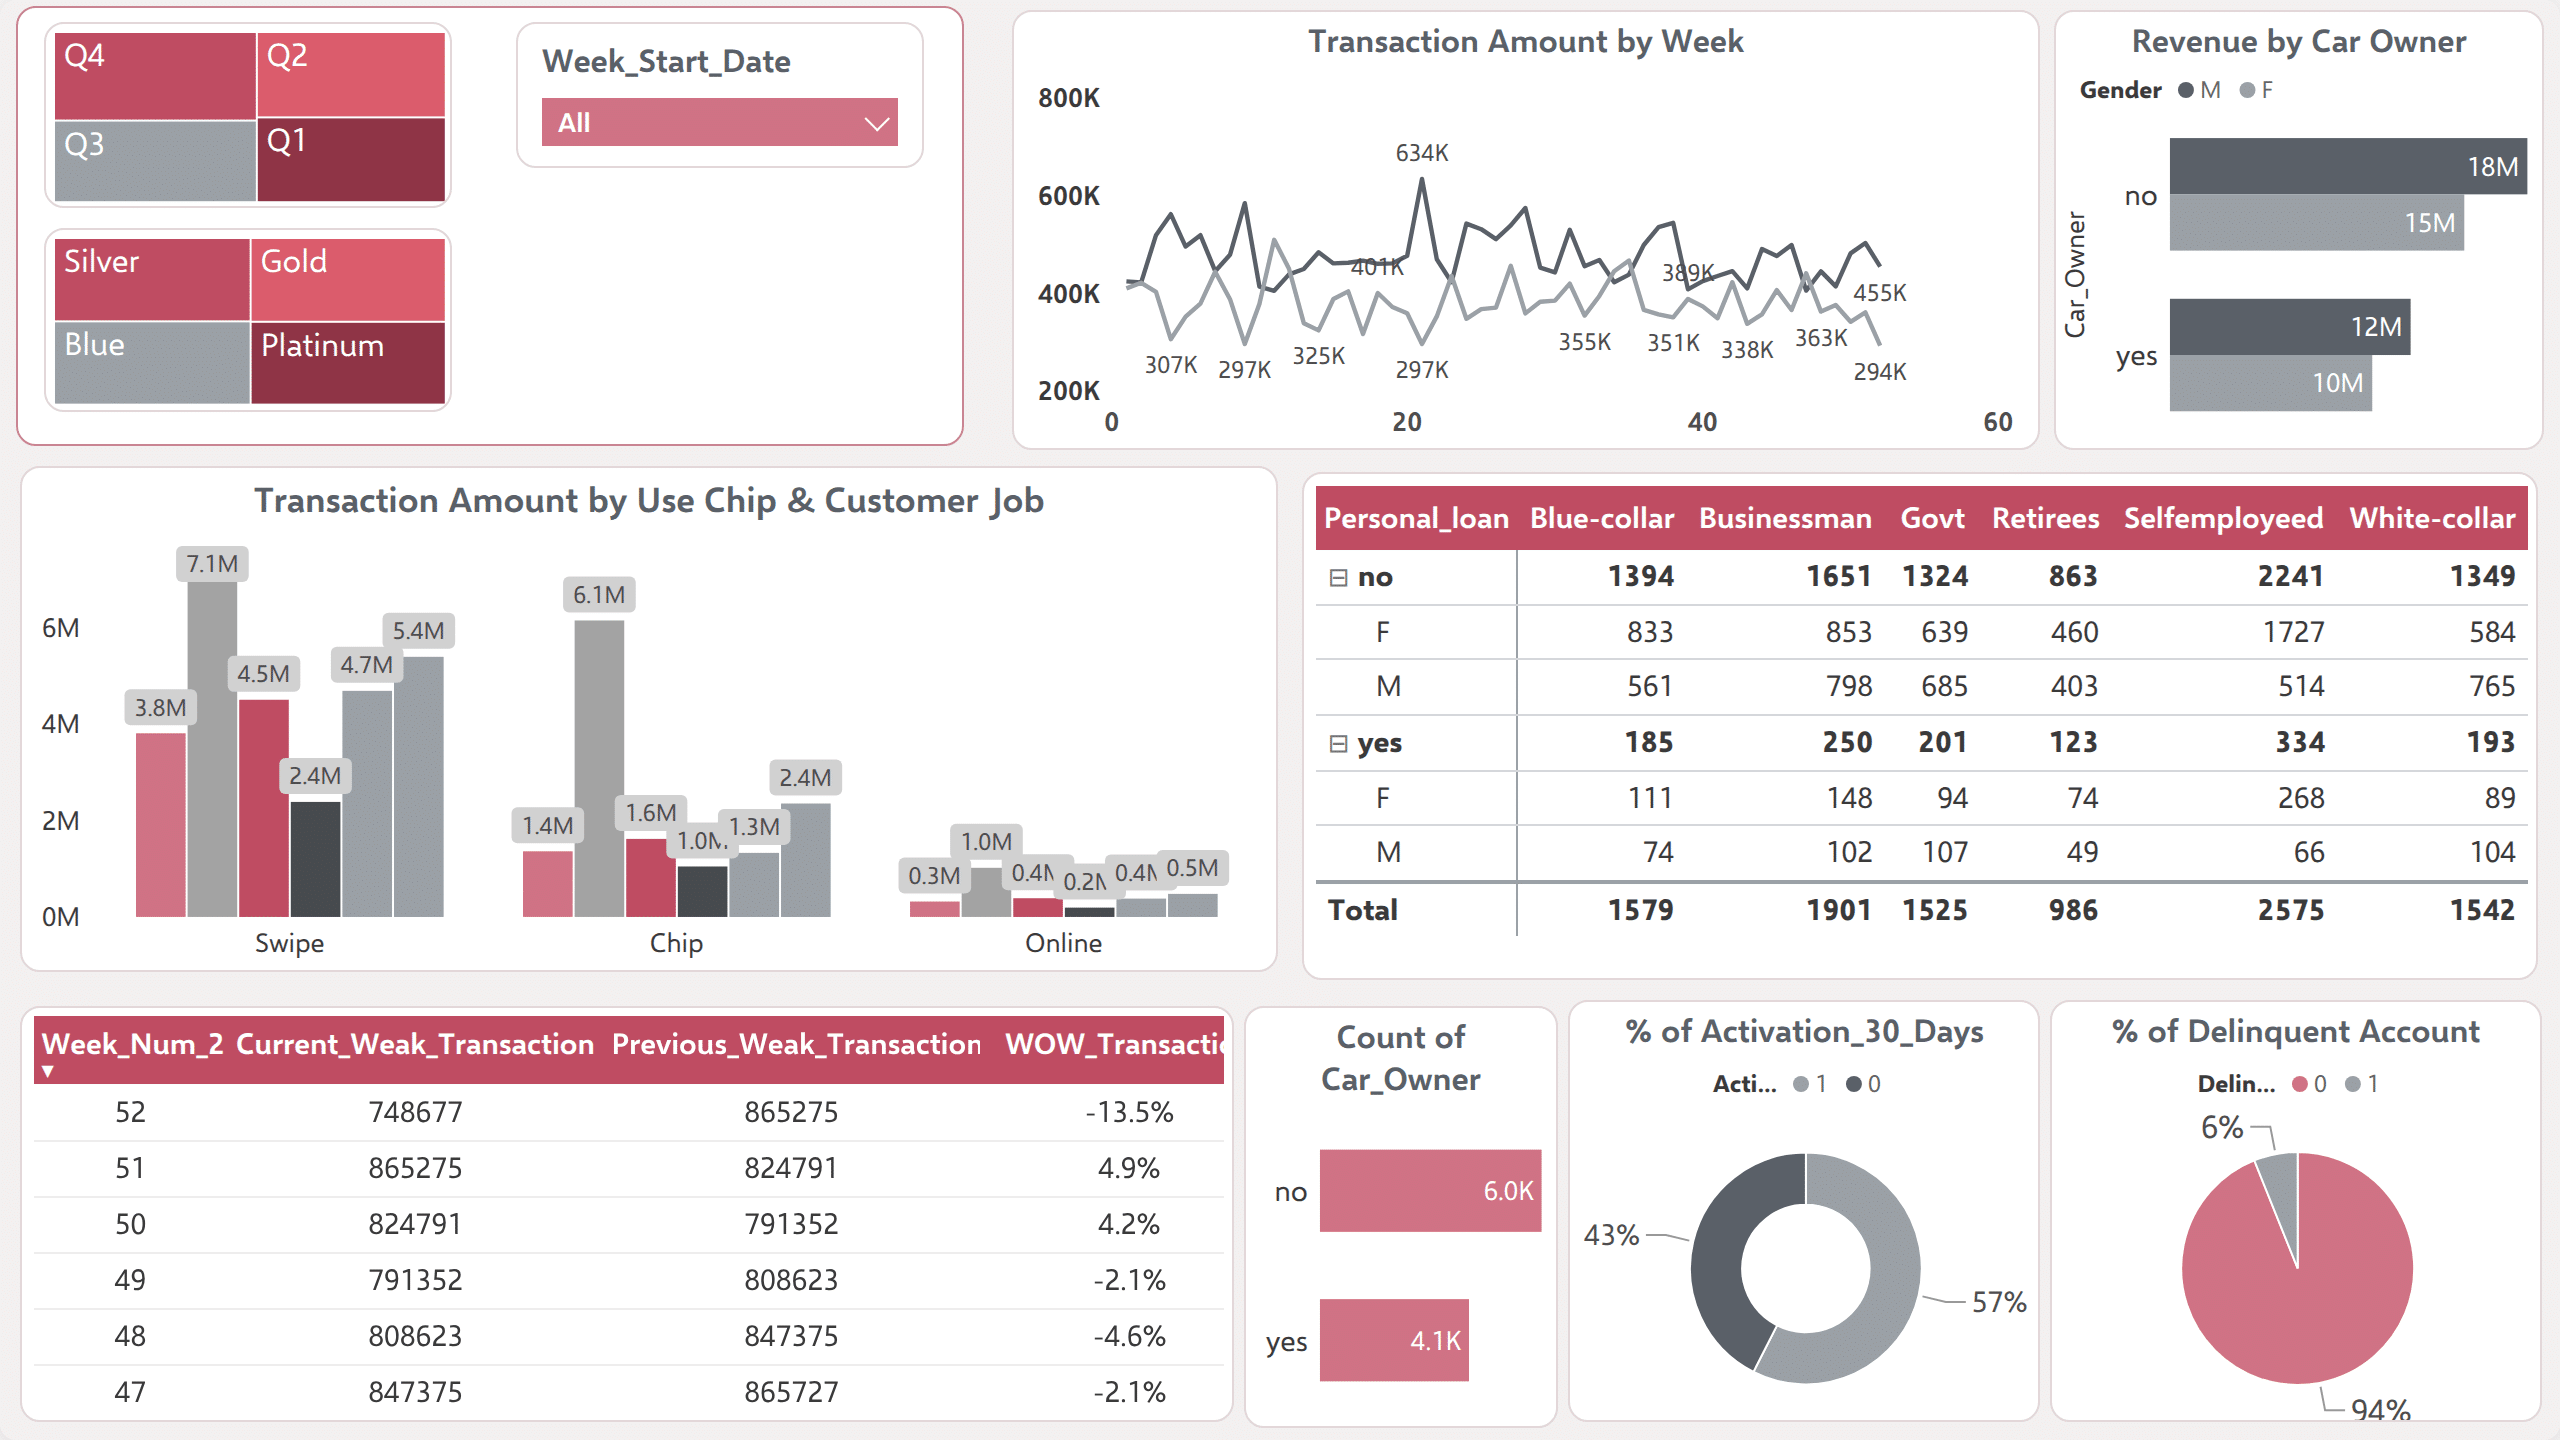
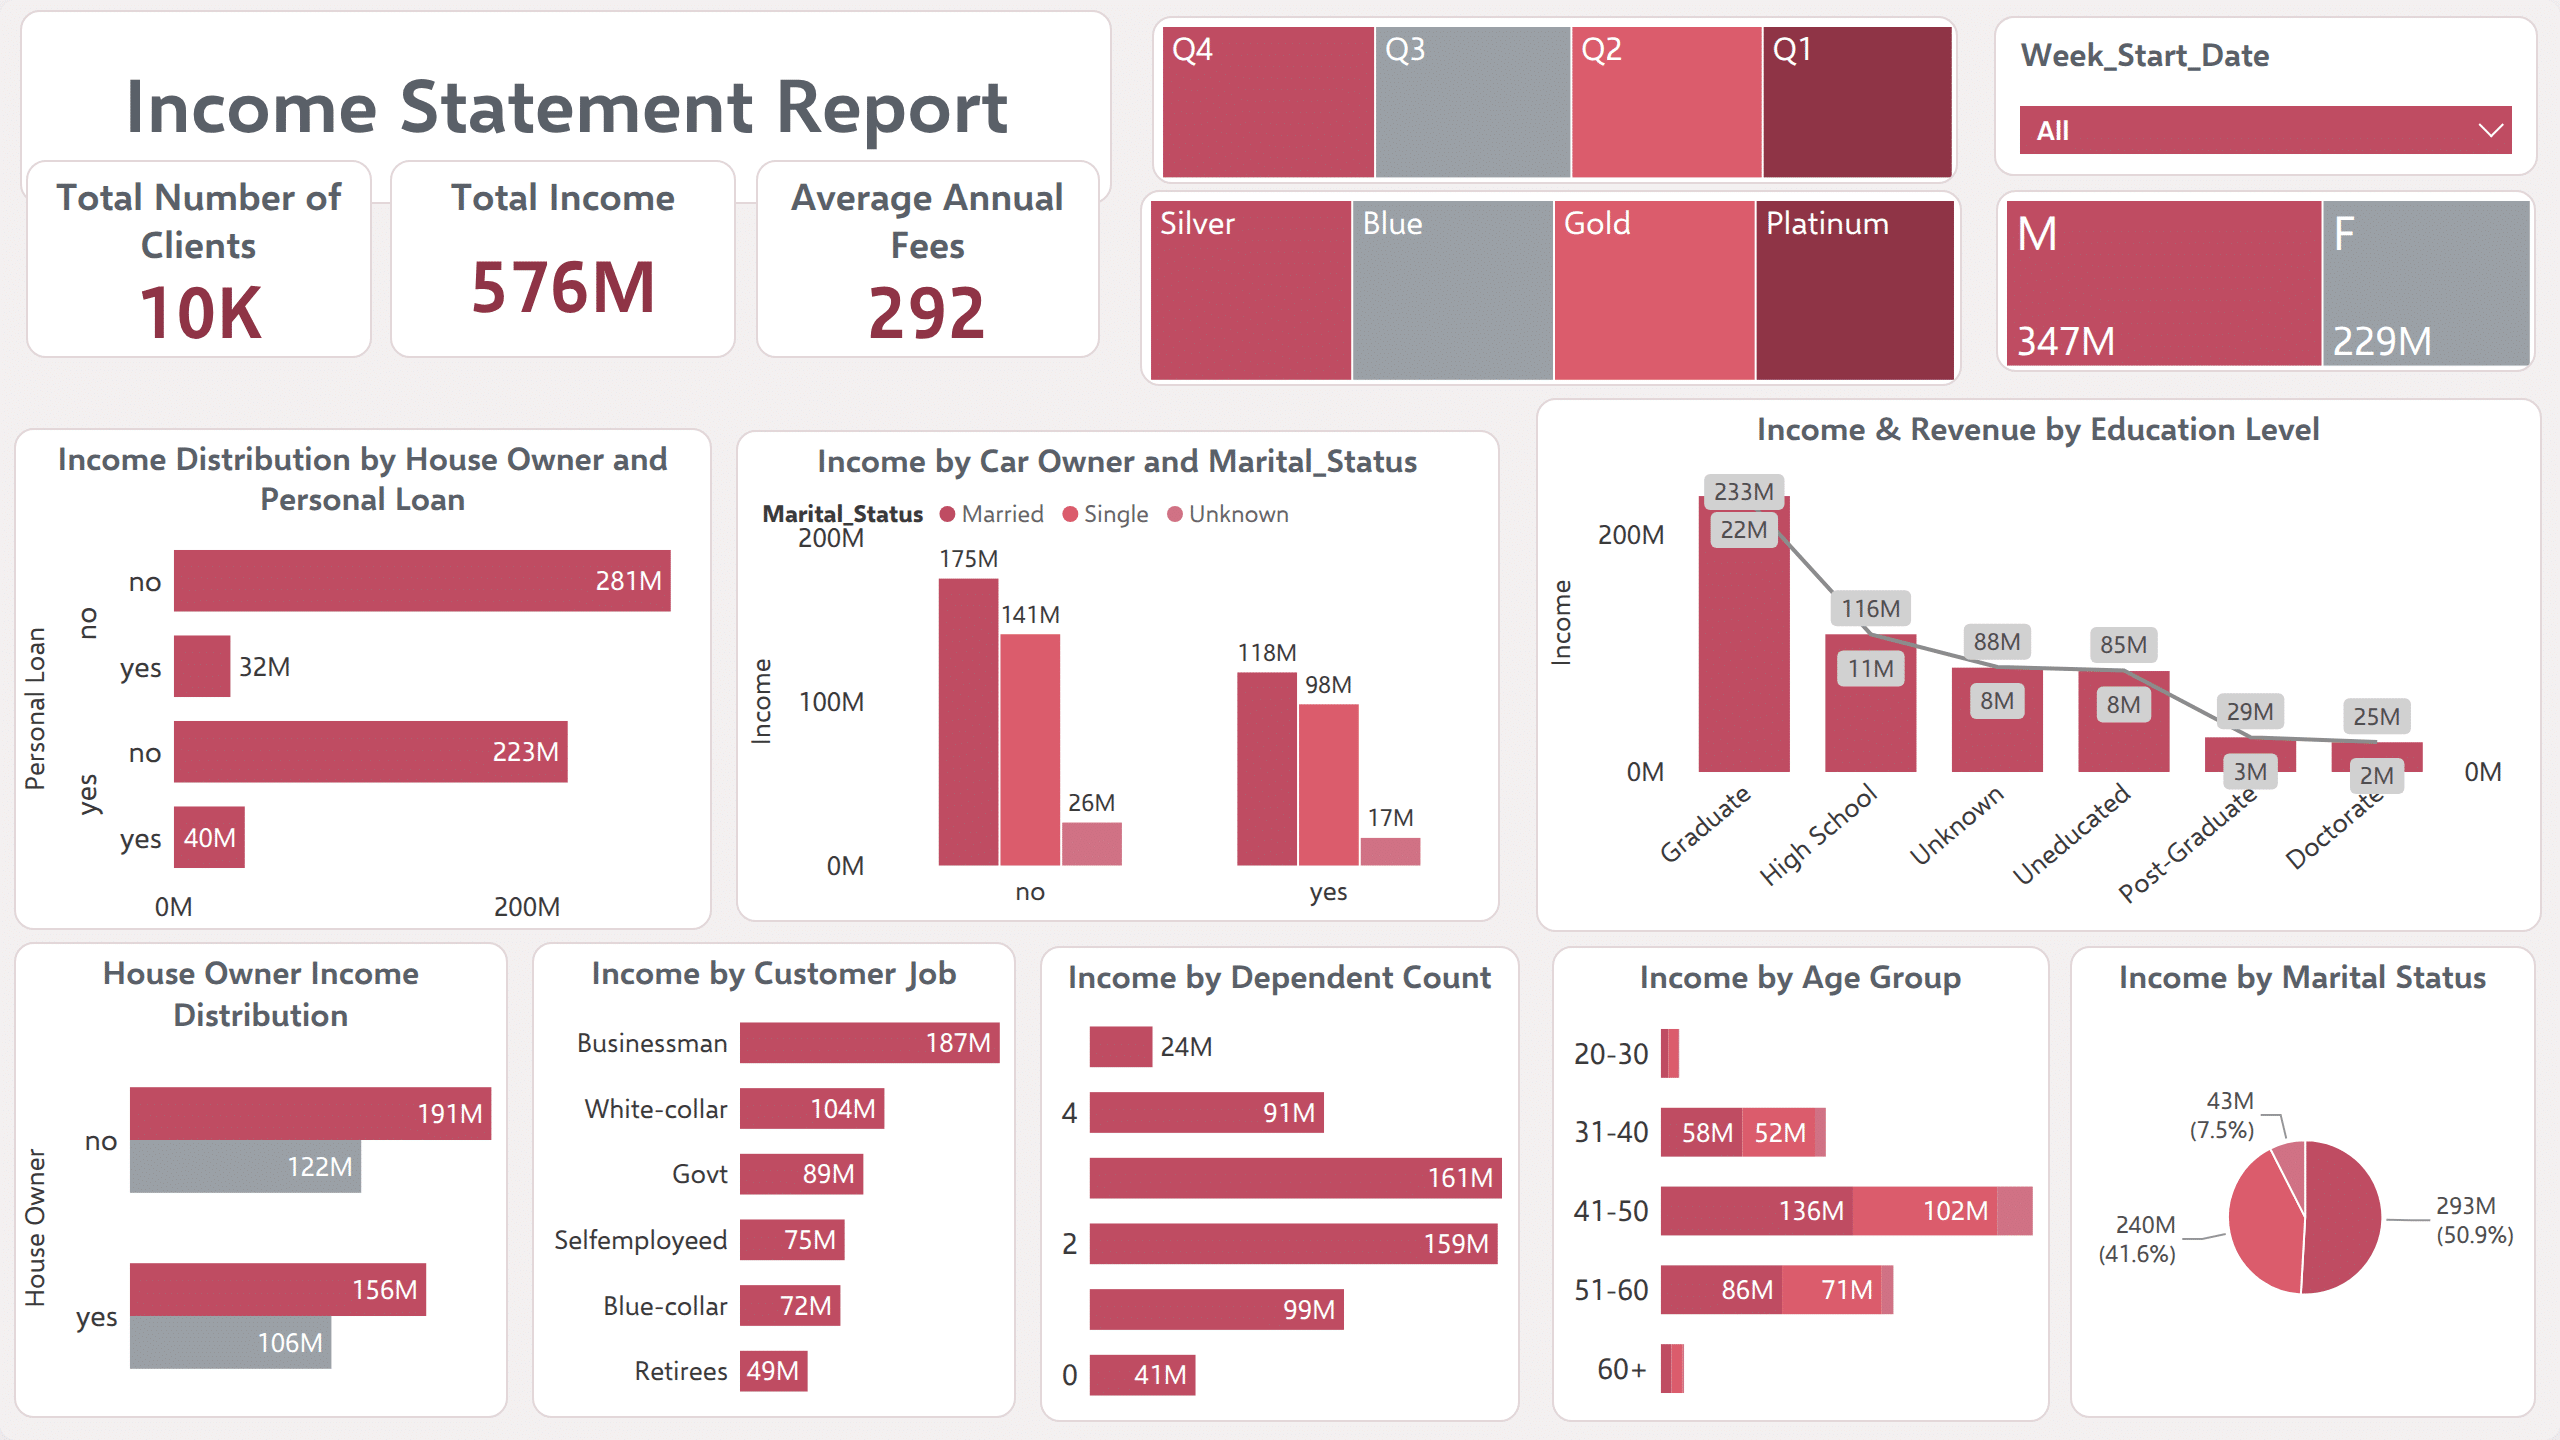
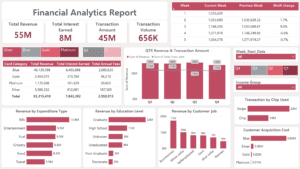
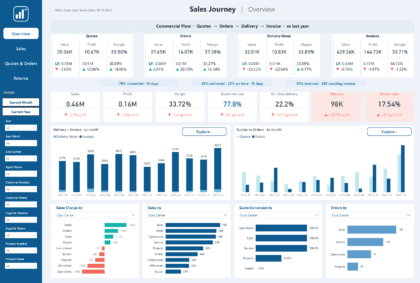
The SolutionOne interactive view of revenue, interest earned, transactions and customer financial segments.
The OutcomeA clear financial picture for management, in one view.
Includes the Power BI file with sample data and financial KPI measures. Plus a PDF guide to connect your data with AI.
Live Demo
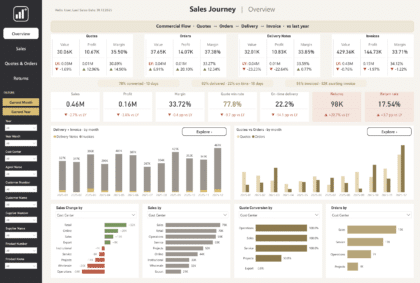
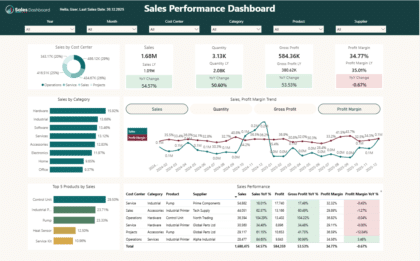
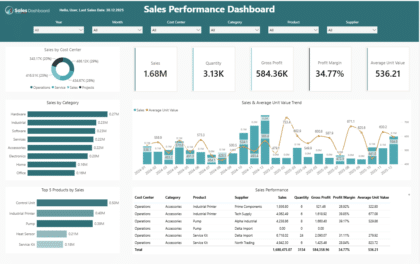
The full report with its real numbers, all four pages. Switch pages, pick a week or income group, and click a tile, bar, slice, point or table row to cross-filter.