
When a customer complains about a late delivery, the first instinct is to blame the driver. Often the delay started long before the truck left: the order waited to be picked, and then waited again at the dock. Without measuring each stage, every late delivery looks like a transport problem.
Follow every delivery through four stages
- Planned: the delivery is scheduled for a date.
- Dispatched: it left the warehouse.
- Delivered: it reached the customer.
- On time: it arrived by the promised date.
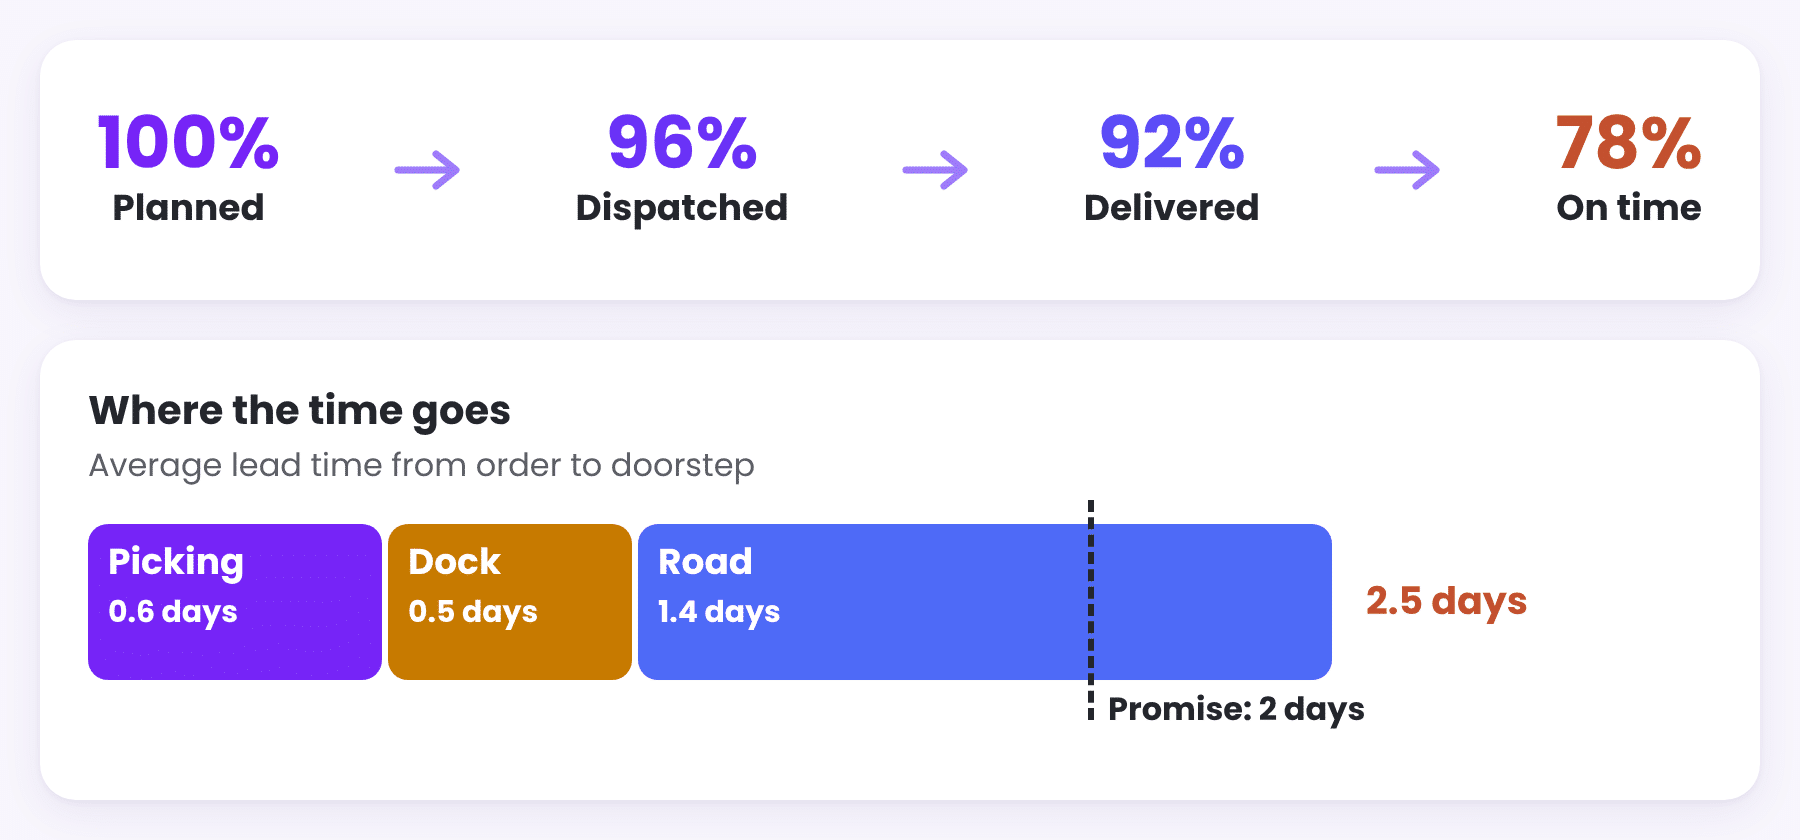
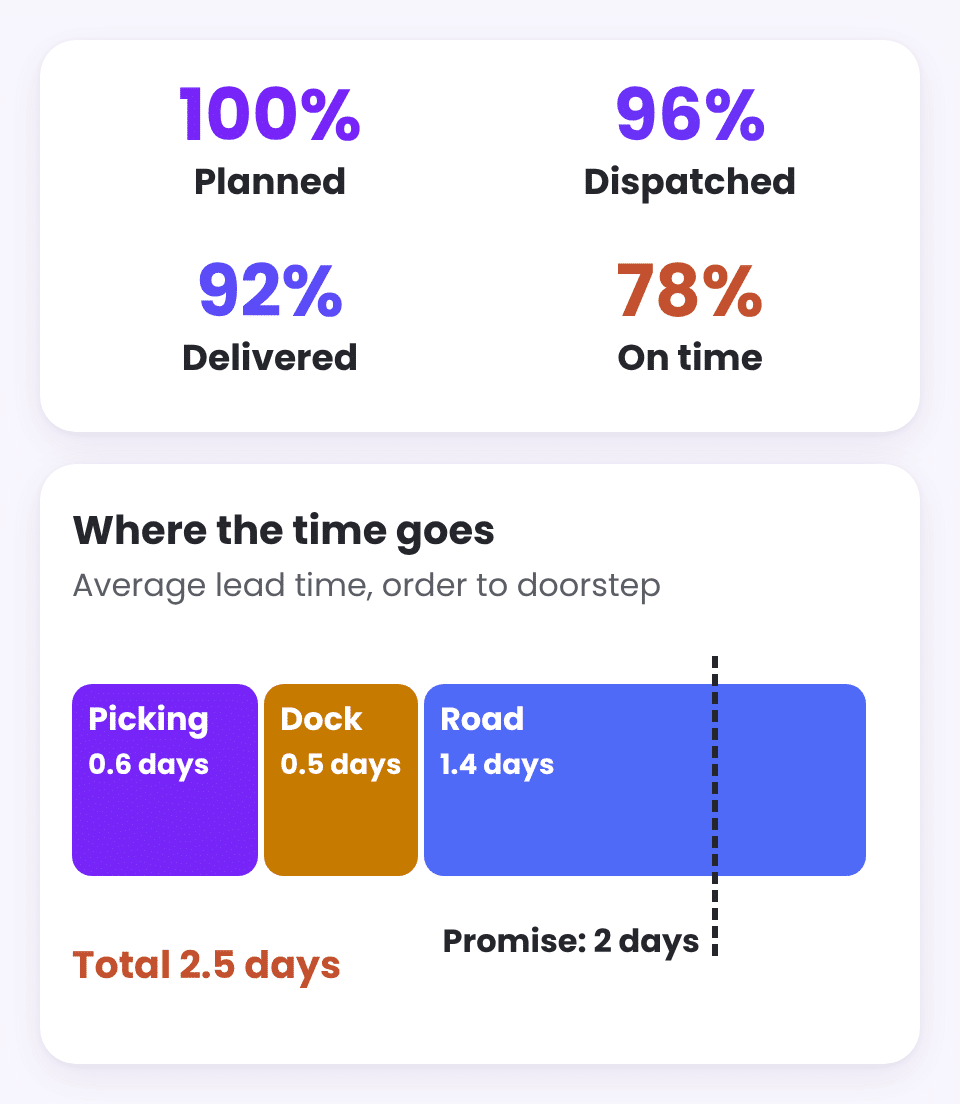
The share of deliveries that reaches each stage shows where they get stuck. A large gap between planned and dispatched points to the warehouse. A gap between delivered and on time points to the road, or to promises that were never realistic.
Split lead time by stage
Average lead time from order to delivery is a useful headline but a poor diagnosis. Split it into picking time (from order to ready), dock time (from ready to dispatched) and road time (from dispatch to delivery), and the bottleneck usually becomes obvious. In the example above, picking and road together take exactly the two days that were promised. It is the half day lost at the dock that pushes deliveries past the promise.
Know what is open right now
History explains, but operations run on the present: what is open, what is overdue and what is due today. A live status view sorted by days overdue is the list the logistics team works from every morning. It is the same idea as tracking open and overdue orders in Where Sales Leak Between the Quote and the Invoice.
Drivers, routes and carriers
On-time % and failure rate by driver, route or carrier show whether a problem is general or local. Deliveries per day show capacity. When several carriers are involved, compare them on reliability, transit time and cost per shipment, not on price alone.
Give exceptions their own page
Failed, returned and unsigned deliveries need names, reasons and customers, not just a percentage. Unsigned delivery notes deserve special attention: without a signature, the delivery is harder to prove and often harder to invoice.
| Question | What to measure |
|---|---|
| Where do deliveries get stuck? | Share reaching each stage: planned, dispatched, delivered, on time |
| Where does the time go? | Lead time by stage: picking, dock, road |
| What needs action today? | Open, overdue and due today |
| Is it a driver, route or carrier issue? | On-time % and failure rate by driver, route, carrier |
| What went wrong? | Failed, returned and unsigned deliveries, with reasons |
Keep reading
From the BistarData shop
Delivery analytics, ready to use
Delivery Flow: Order to Doorstep follows every delivery from order to doorstep:
- One flow, four stages: click a stage and the whole page filters to it
- Lead time by stage: picking, dock and road
- Live status: open, overdue and due today
- Drivers and routes: deliveries per day, on-time % and failure rate
- Exceptions: failed, returned and unsigned deliveries, with reasons
For carrier, warehouse and shipping cost analysis, see Logistics and Carrier Performance Intelligence.