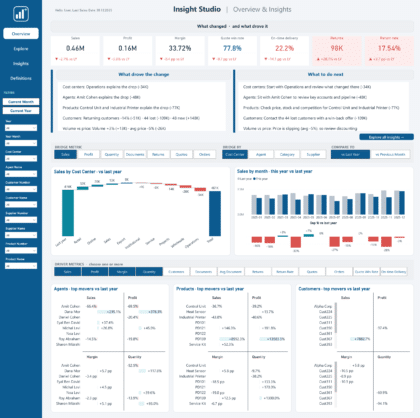
The ChallengeOne store is falling behind. Do you know which one?
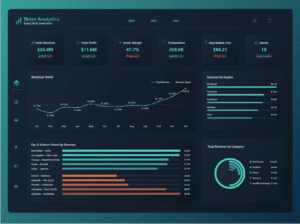
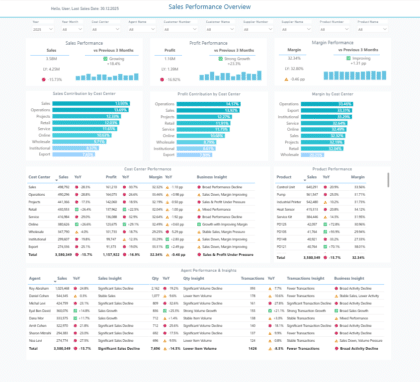
The SolutionCompare revenue, profit, transactions and average sale across stores and regions.
The OutcomeFocus on the locations that need attention.
Includes the Power BI file with a structured data model and sample data. Plus a PDF guide to connect your data with AI.
Live Demo
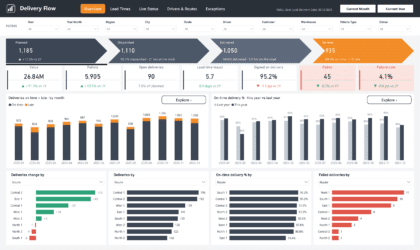
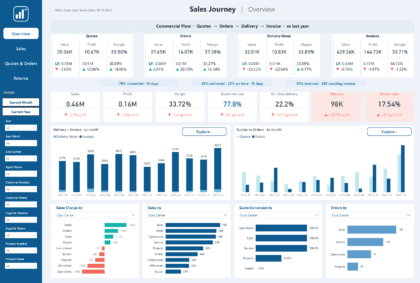
All three report pages with their real numbers. Switch pages, pick a year, open the filter panel, and click a month, a column, a category or a store row to cross-filter.