Home » Shop » Sales Focus | Interactive Power BI Analytics
Sales Focus | Interactive Power BI Analytics
The ChallengeWant an instant view of yesterday’s sales or month to date results, with the flexibility to explore every detail?
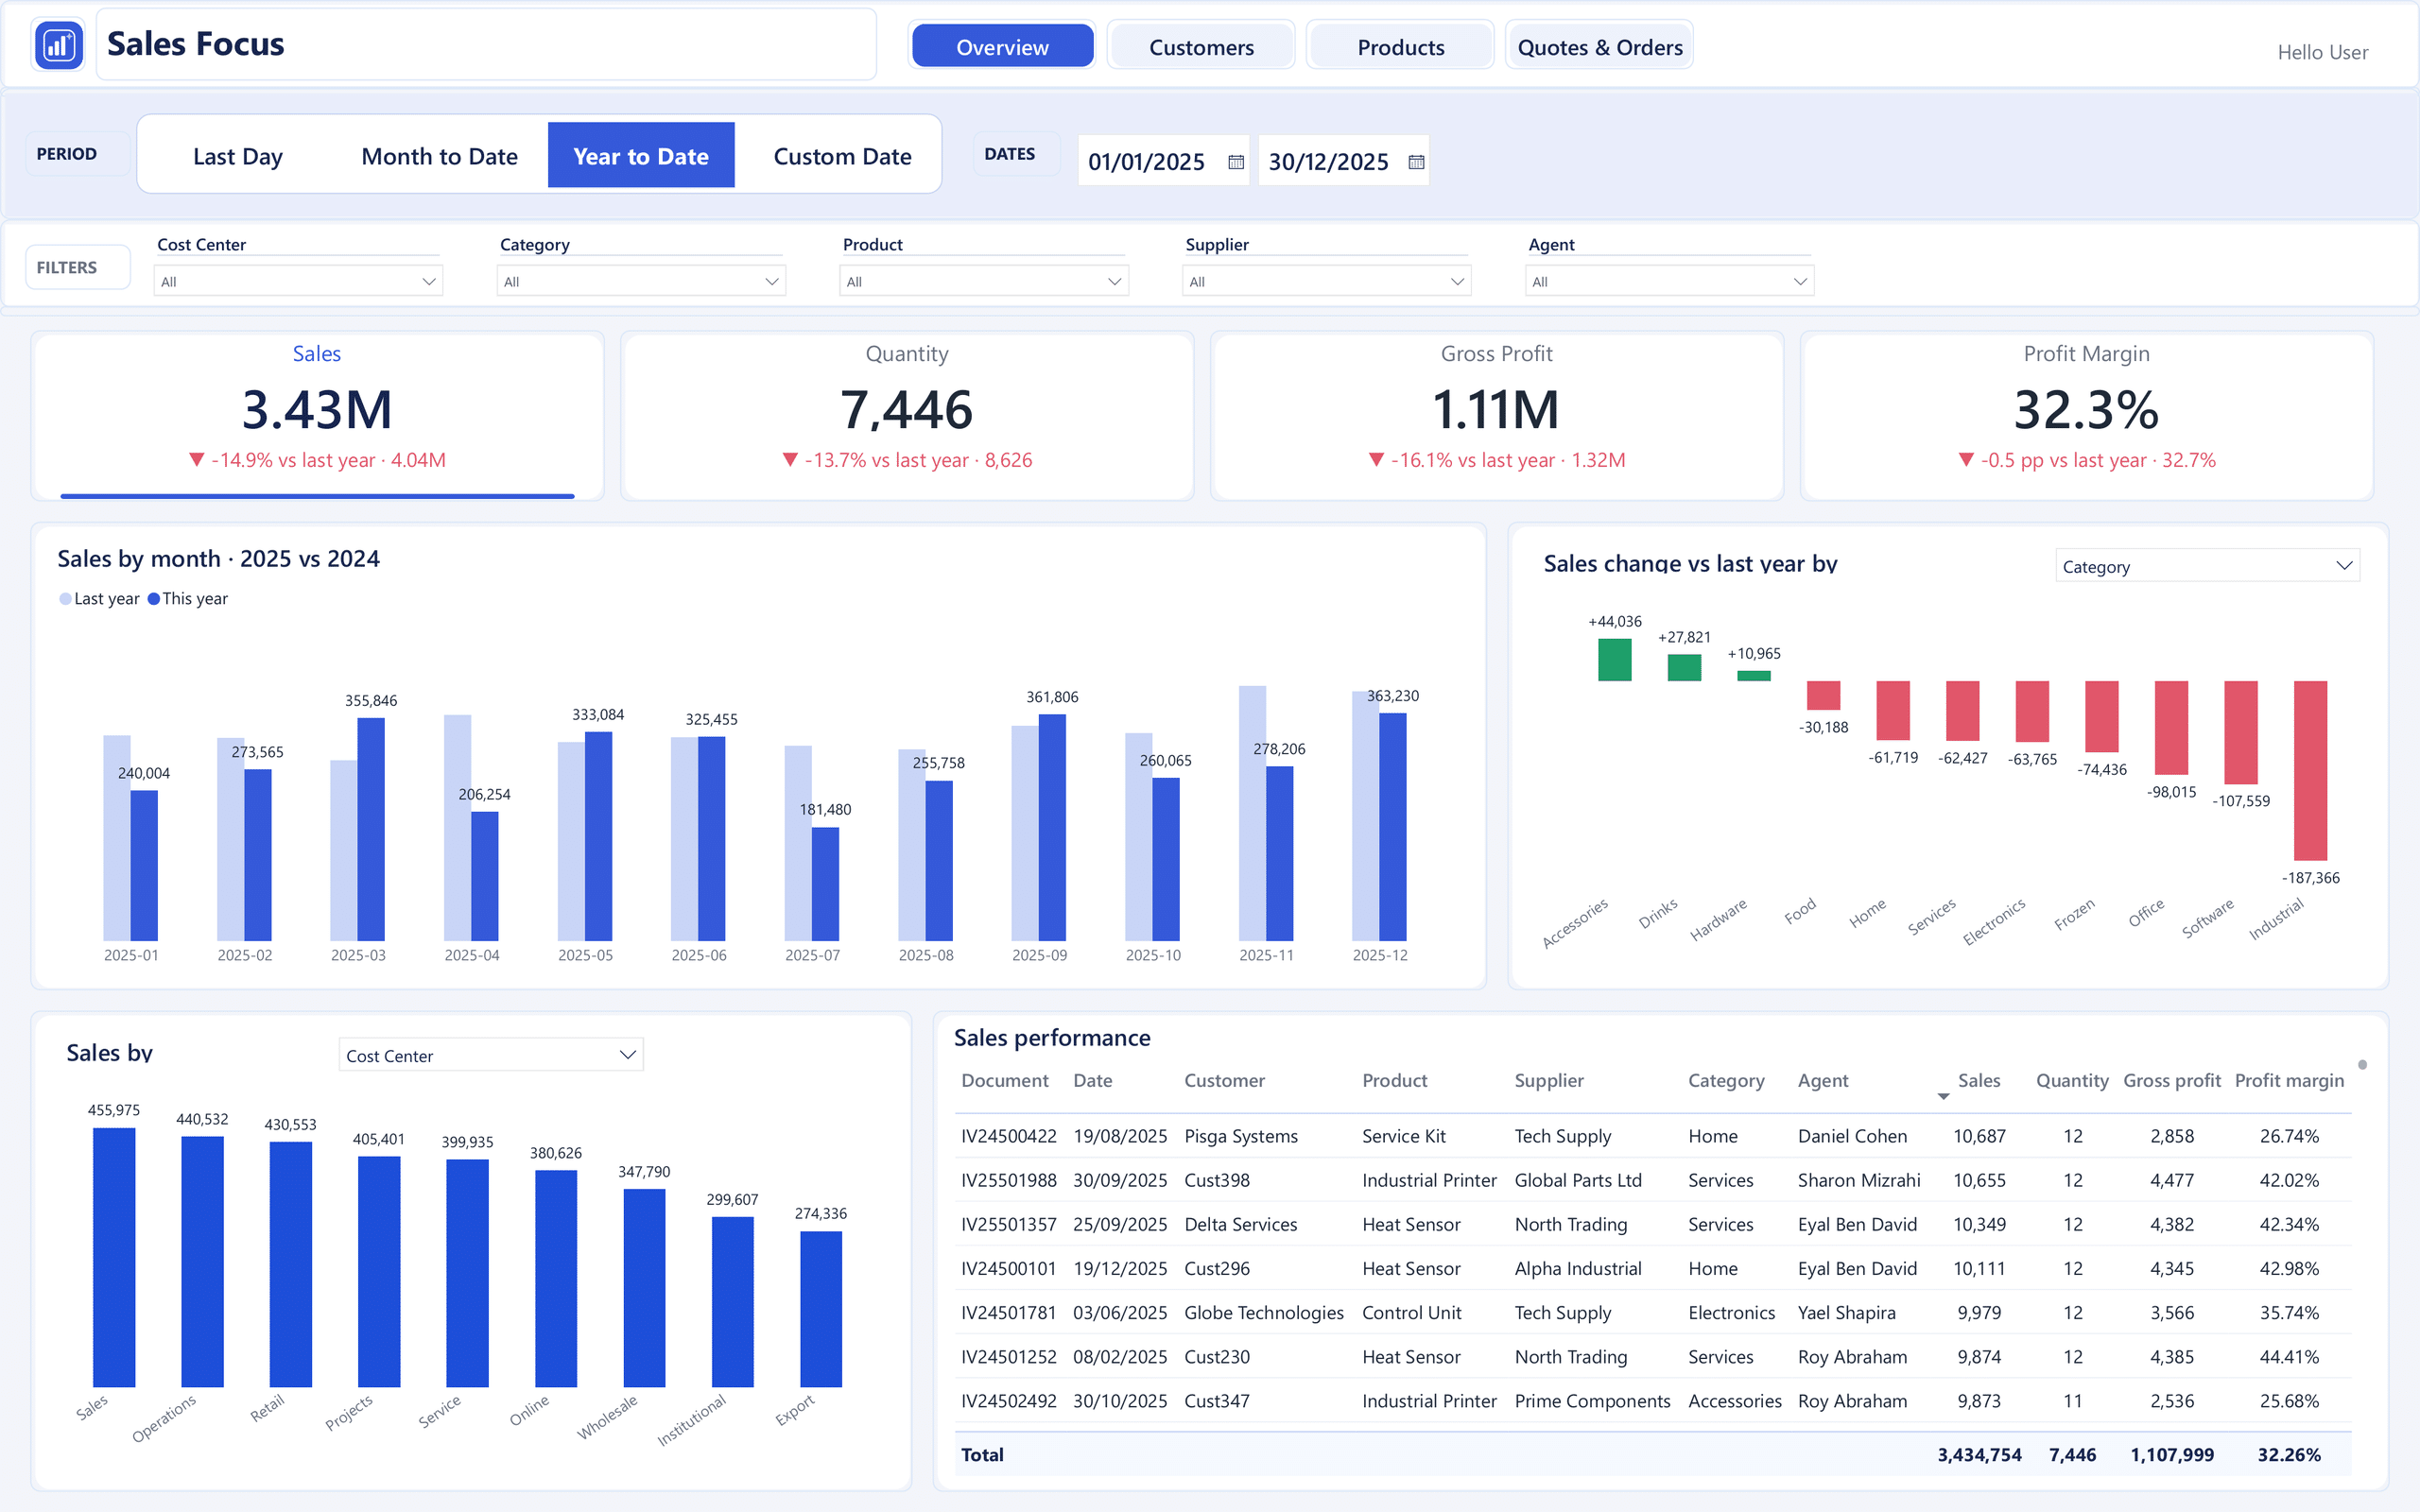
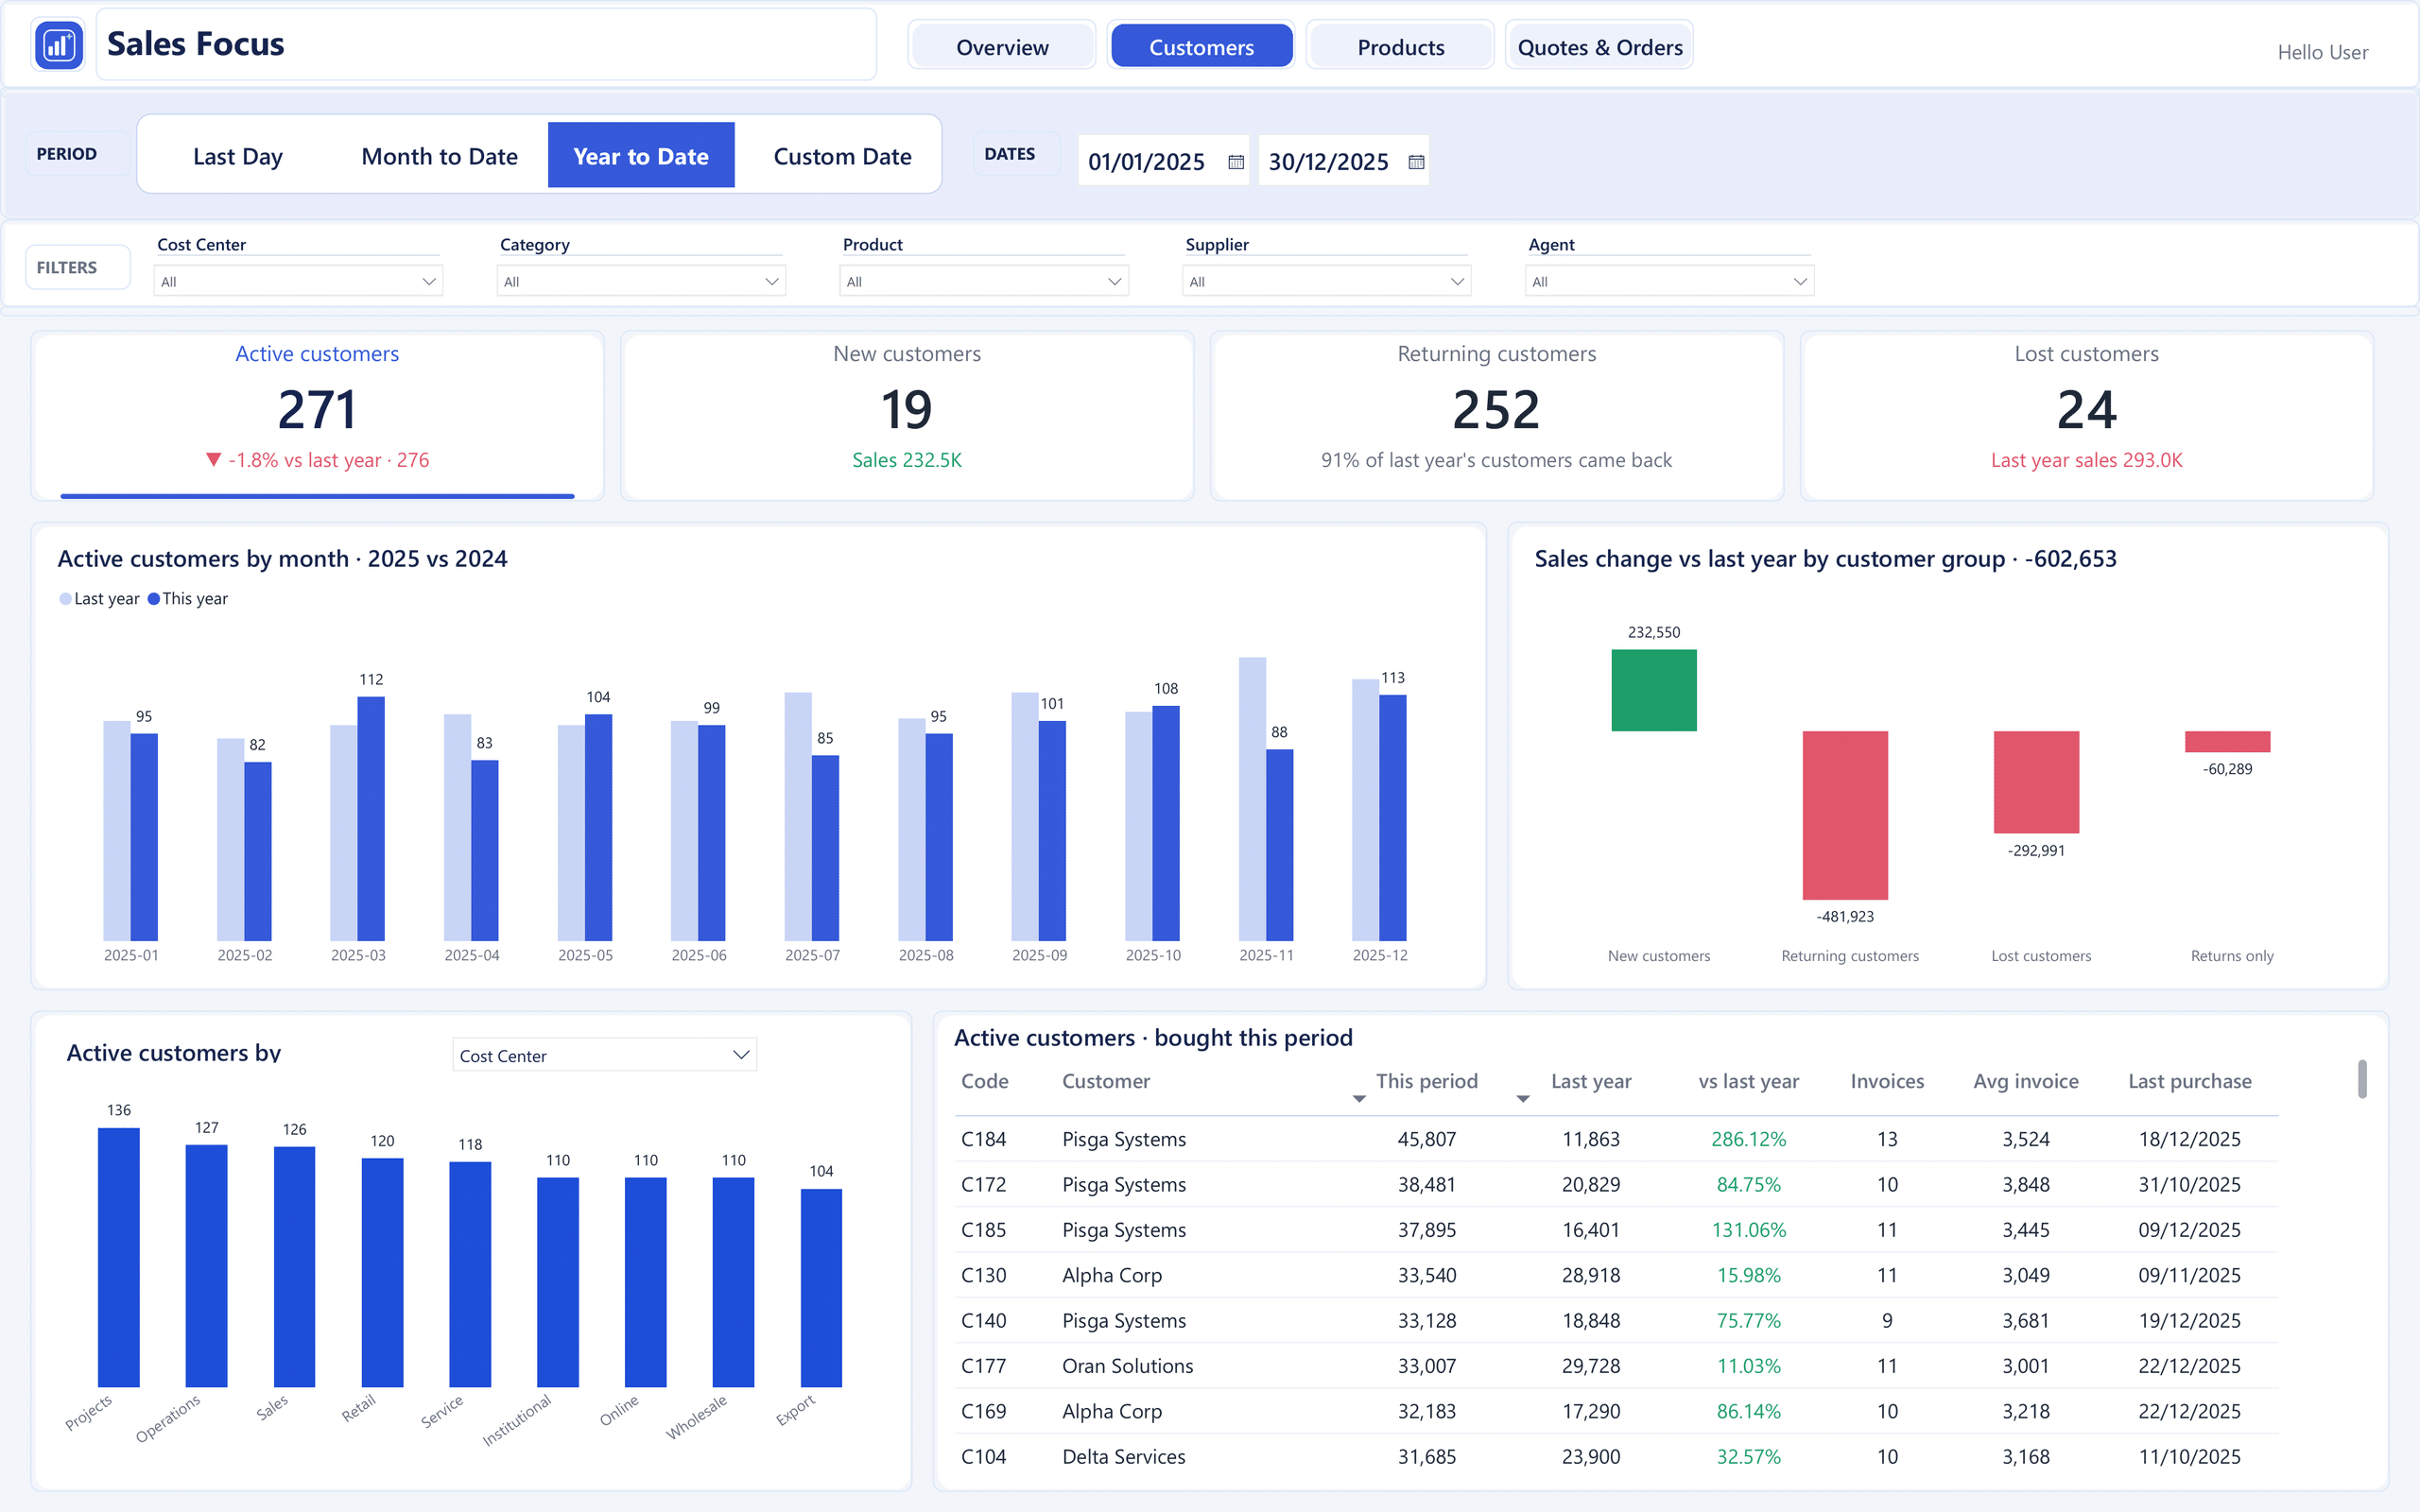
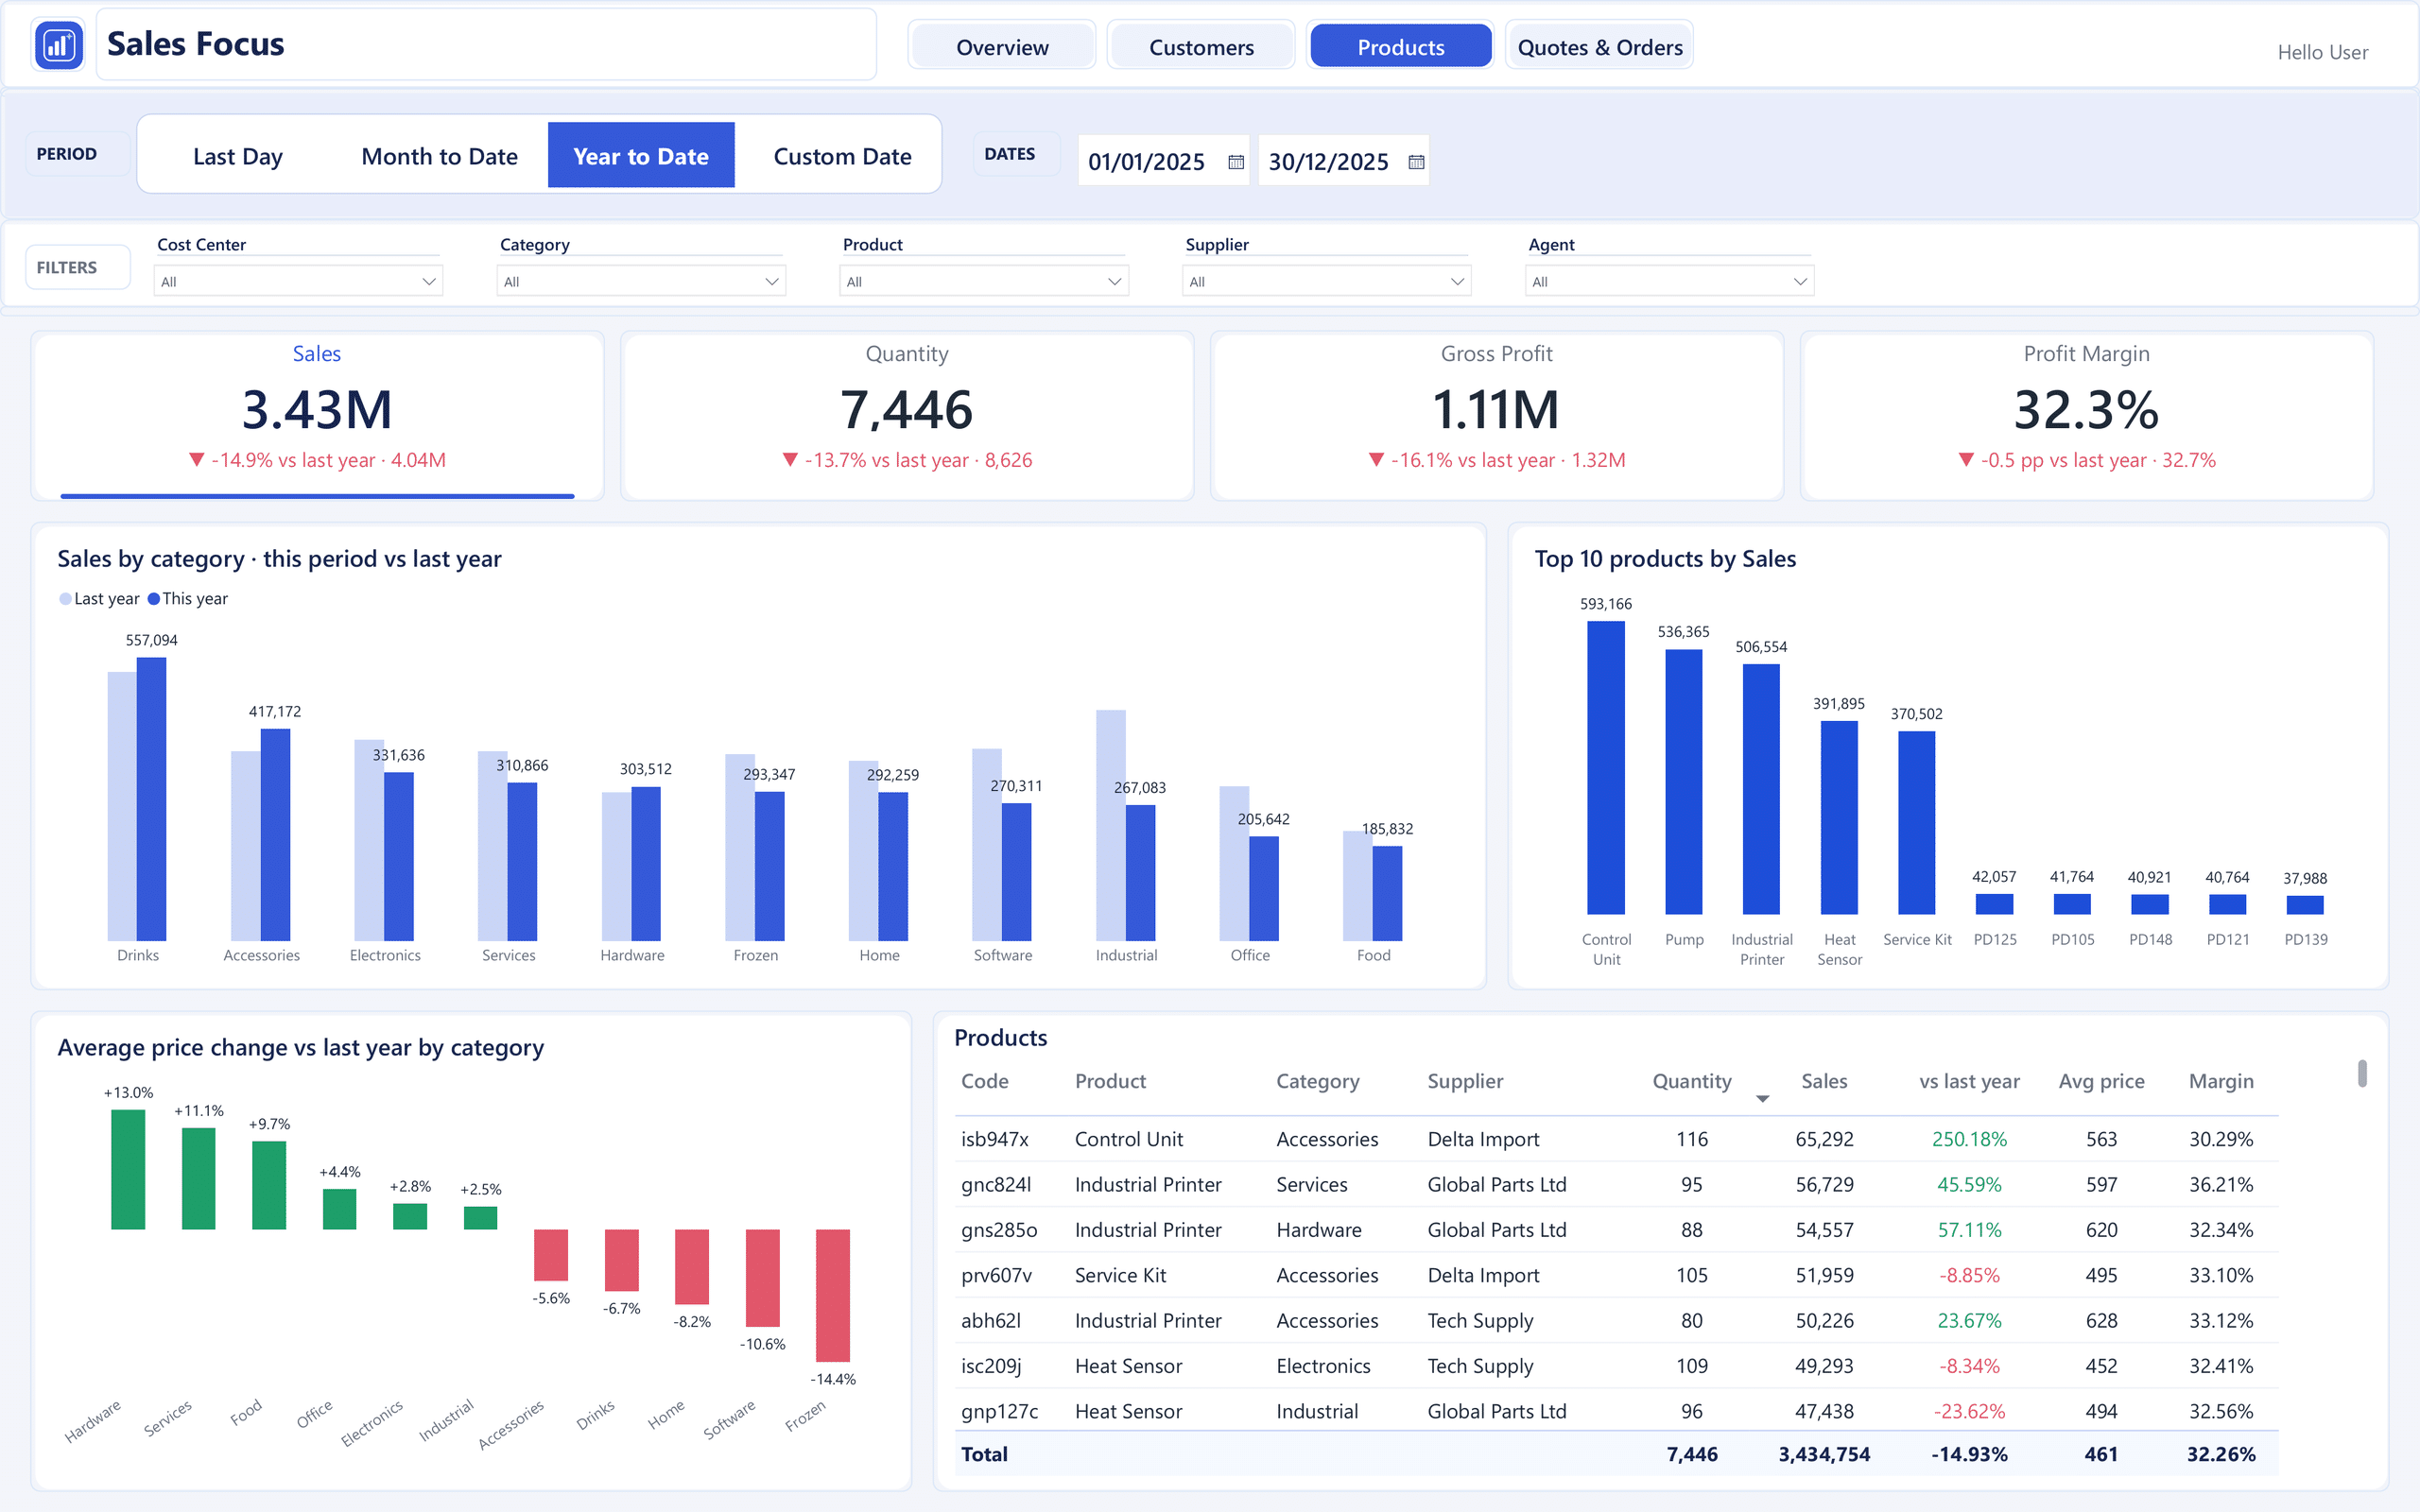
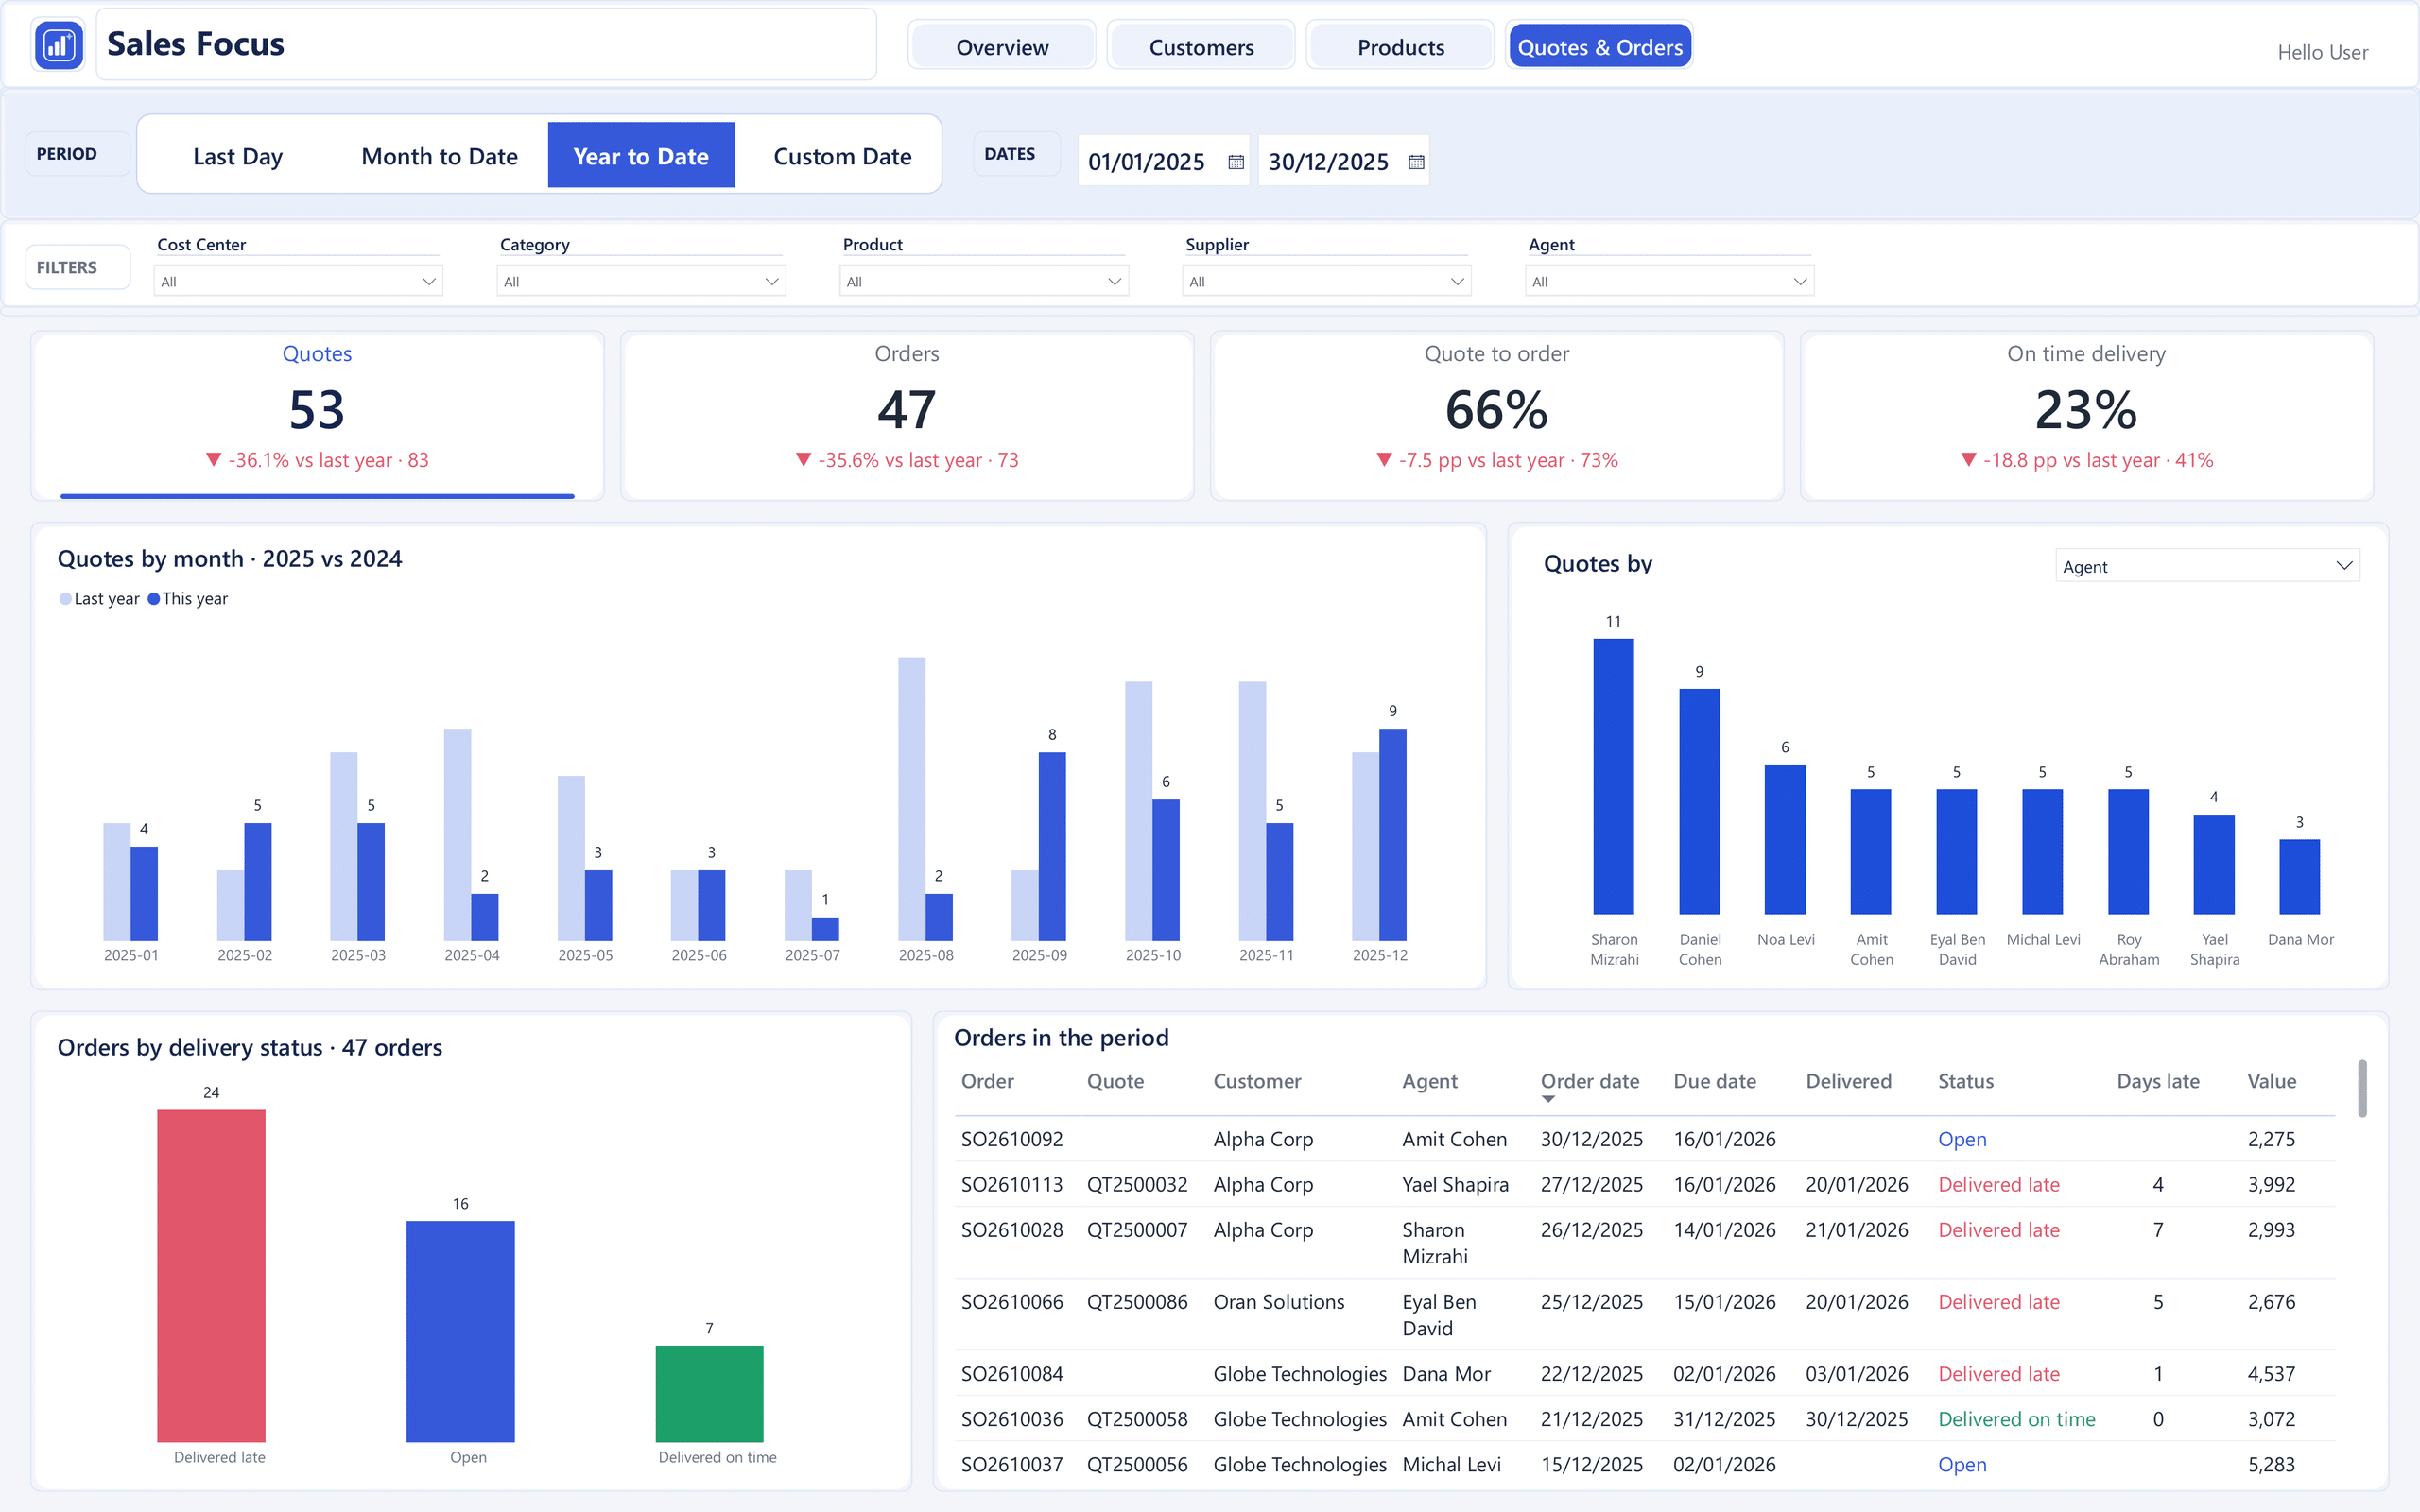
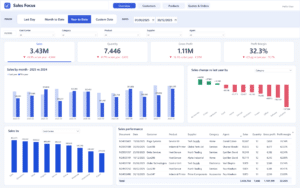
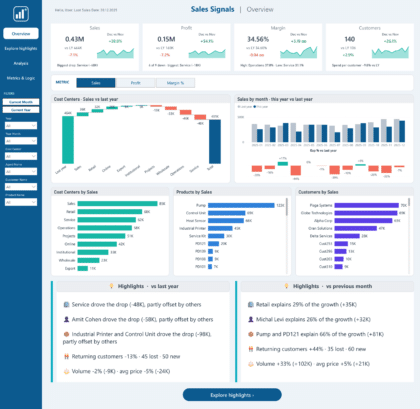
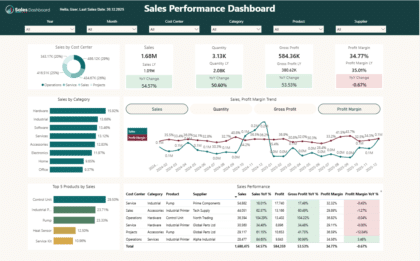
The SolutionStart with your preferred view: Last Day, MTD or YTD. Compare with last year, switch KPIs and drill down to a single day using an interactive timeline.
The OutcomeUnderstand what changed in minutes, without waiting for a new report.
Includes the Power BI file (4 pages), sample data in Excel and a PDF guide with ready AI prompts. Connects to Excel or SQL Server.
Live Demo
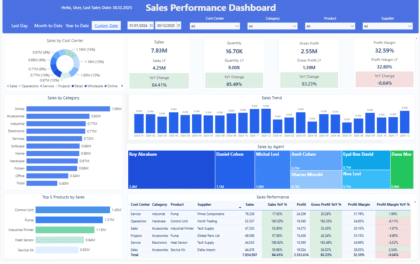
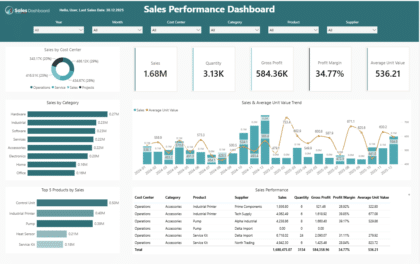
The real report with sample data. Try all four pages: pick a period, click a KPI card to switch the metric, use the filters, and click any column or row to filter the page.
$ 49.00
The site is secured to the strictest standard.
Our customer service is available to you
A wide range of different payment options
Share Sales Focus | Interactive Power BI Analytics