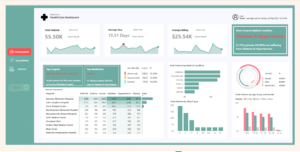
The ChallengeWhich department is under pressure, and what does it cost?
The SolutionRevenue, patient activity and department performance in one dashboard for healthcare teams.
The OutcomeSee how every department is doing and where to act.
Includes the Power BI file with a structured data model and sample data. Plus a PDF guide to connect your data with AI.
Live Demo
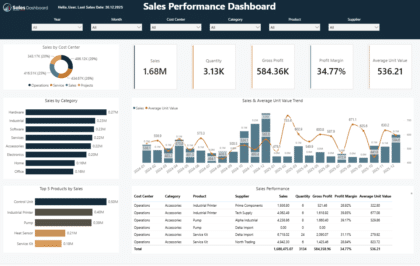
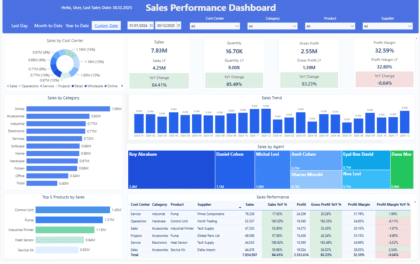
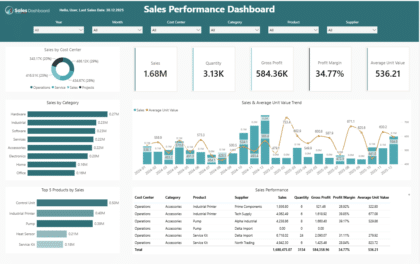
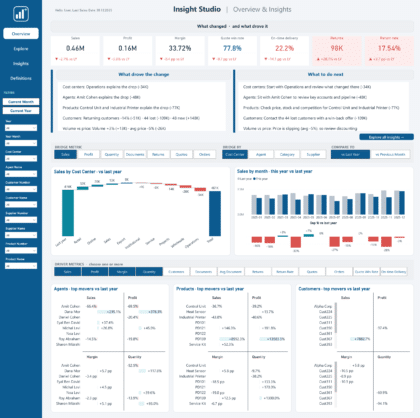
All three report pages with their real numbers. Open Filters to slice by year, month, hospital, gender, condition or insurer, and click a bar, month, ring or matrix cell to cross-filter.