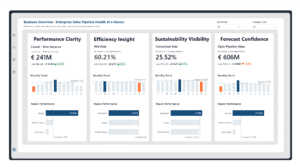
The ChallengeIs the pipeline strong enough for next quarter?
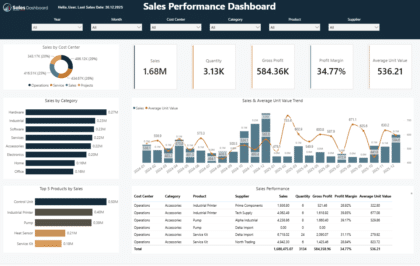
The SolutionGrowth KPIs, funnel and pipeline analysis and regional trends in one executive view.
The OutcomeSpot gaps in the pipeline early, while there is still time to close them.
Includes the Power BI file with a structured data model and sample data. Plus a PDF guide to connect your data with AI.
Live Demo
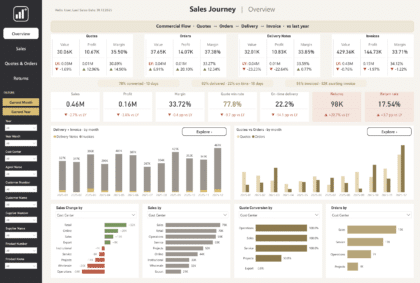
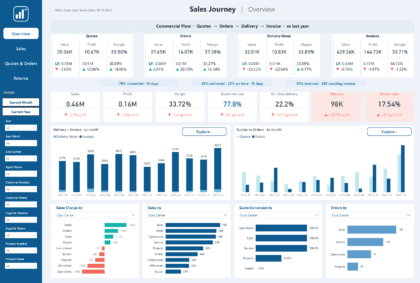
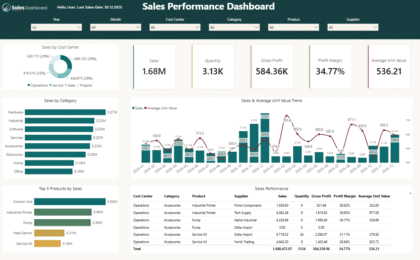
All five report pages with their real numbers. Pick a month, year or company size, flip the heatmap measure, and click a bar, month, stage, bubble or cell to cross-filter.