Home » Shop » Dynamic Sales Performance Analytics
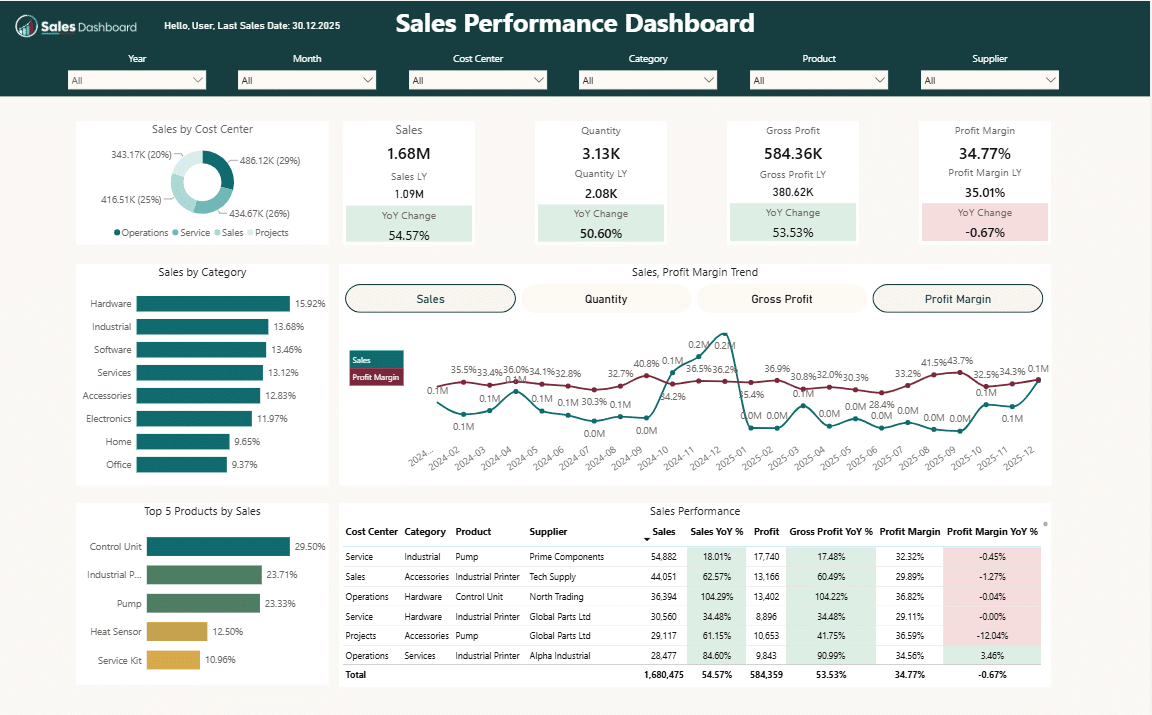
The ChallengeSales went up, but did profit follow?
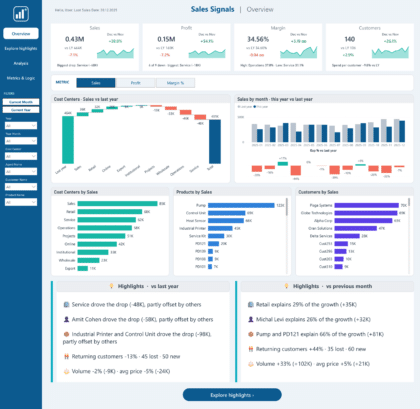
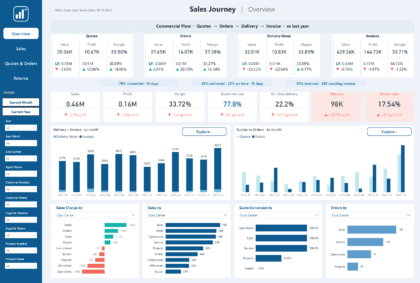
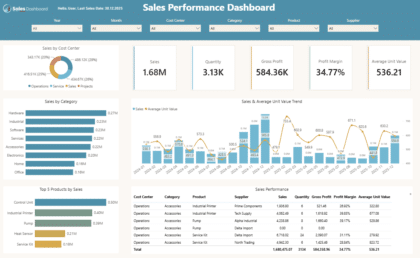
The SolutionPick one or more metrics and compare them on one dynamic trend chart, against last year.
The OutcomeSee how your metrics move together and catch a gap early.
Includes the Power BI file with sample data, year over year measures and the multi metric logic. Plus a PDF guide to connect your data with AI.
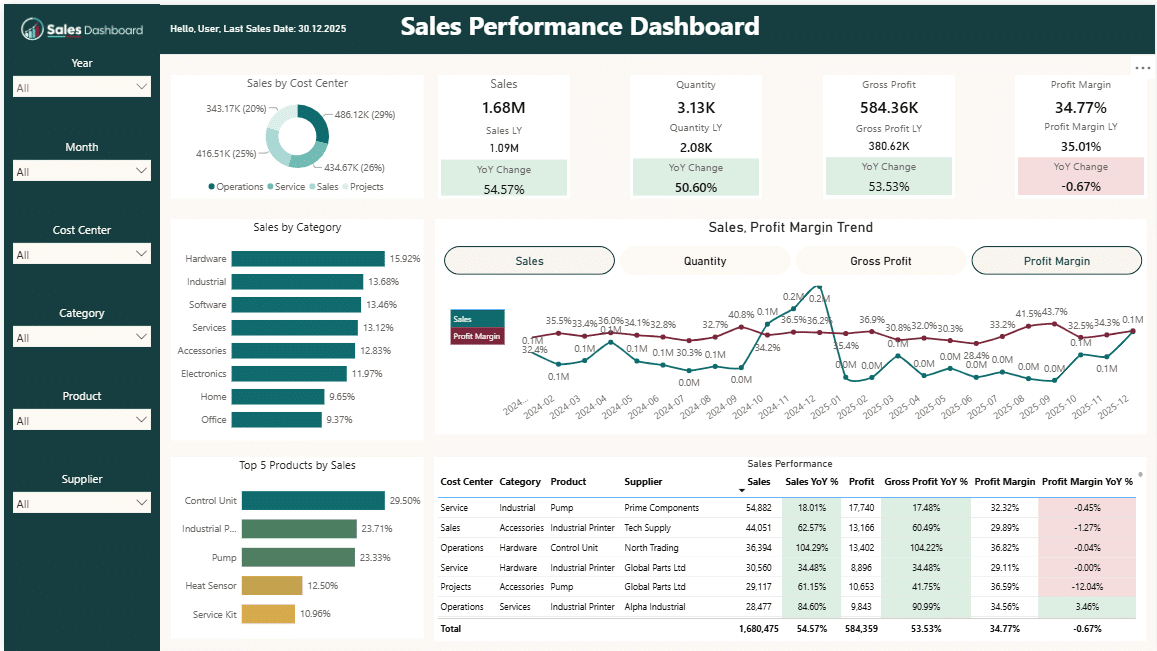
The real report with its real numbers. Switch the trend between Sales, Quantity, Gross Profit and Profit Margin, use the slicers, and click any chart.
Open the demo full screen ⤢
$ 29.00
The site is secured to the strictest standard.
Our customer service is available to you
A wide range of different payment options
Share Dynamic Sales Performance Analytics