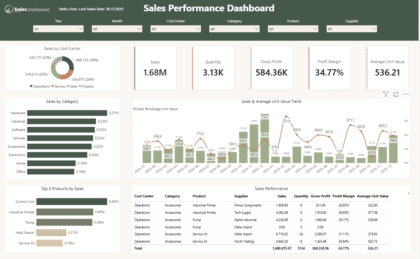
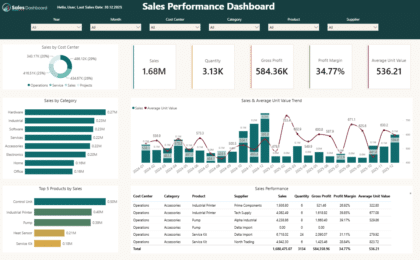
Explore multiple business metrics in one dynamic analytical experience.
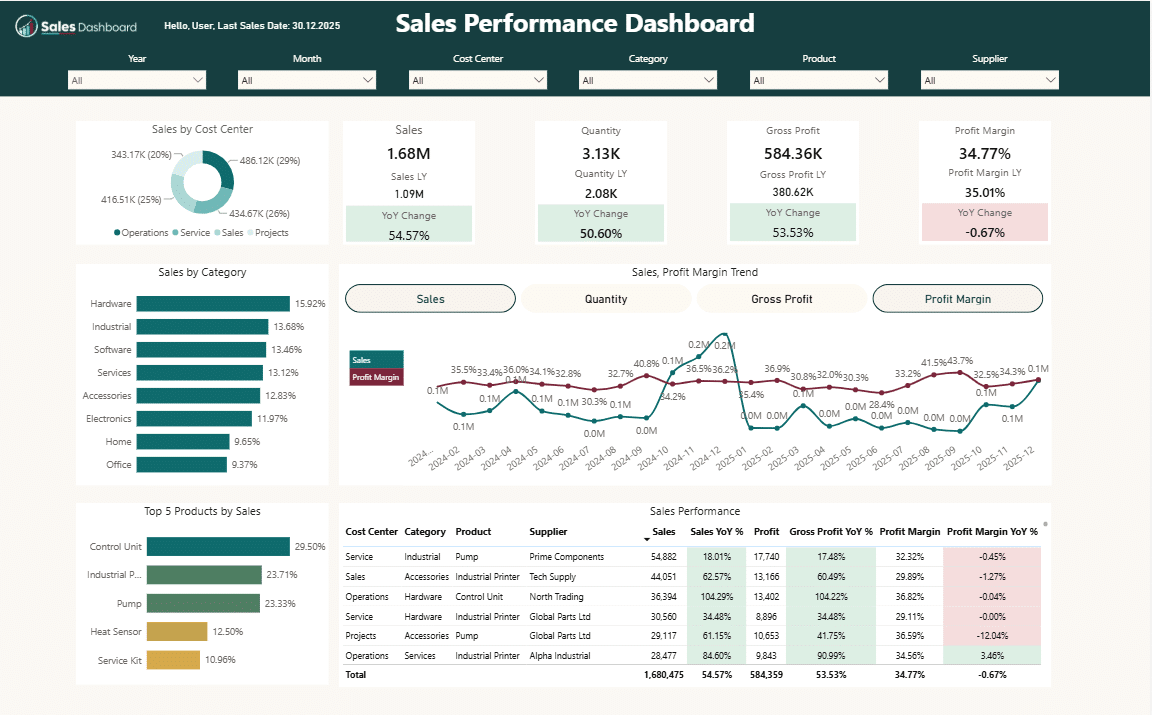
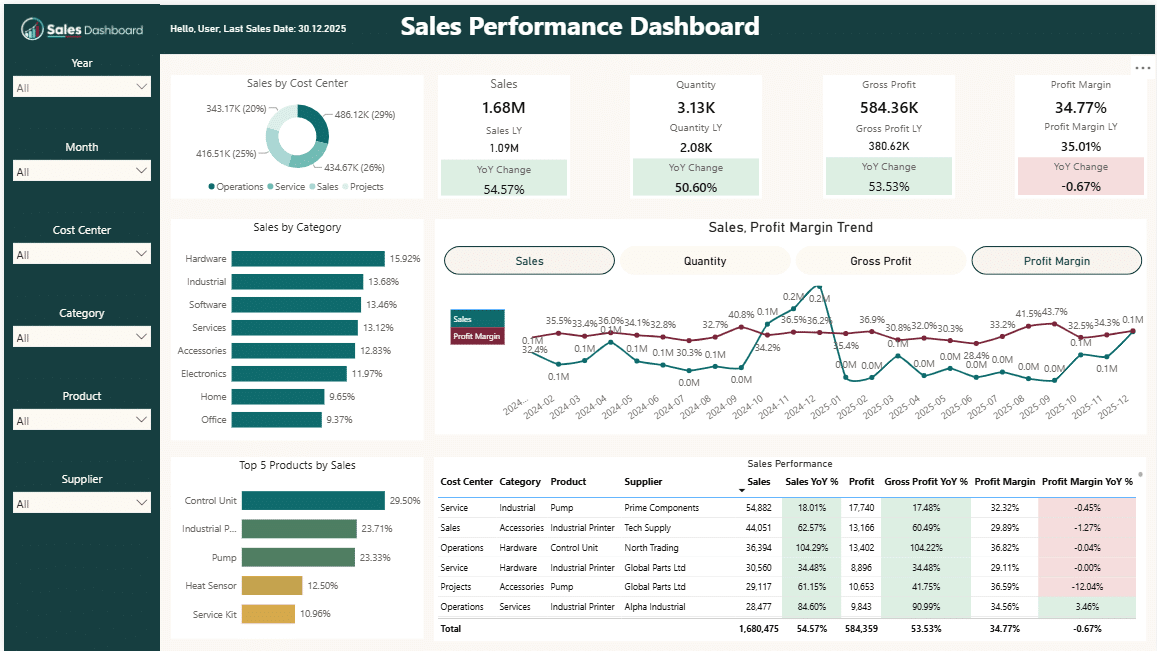
Dynamic Performance Analytics is a ready to use Power BI solution designed to help businesses analyze Sales, Quantity, Gross Profit, Profit Margin, products, categories, cost centers, and supplier performance from one clear and interactive view.
Unlike a traditional dashboard with fixed charts, this model includes a dynamic multi metric trend visual that allows users to select one or multiple business metrics and analyze them together within the same chart.
The visual automatically adapts to the selected metrics, including a dynamic title, custom legend, consistent metric colors, and a dedicated percentage scale for Profit Margin. This creates a flexible analytical experience without the need to switch between multiple separate charts.
Key Analytics
Sales, Quantity, Gross Profit and Profit Margin performance
Previous Year and YoY comparison
Cost Center analysis
Category performance
Top Product analysis
Supplier performance
Dynamic multi metric trend analysis
Single and multiple metric selection
Dynamic chart title
Custom dynamic legend
Dedicated percentage scale for Profit Margin
Interactive filters and detailed performance table
What You Receive
Power BI PBIX file
Ready to use interactive dashboard
Dynamic multi metric trend functionality
Custom dynamic legend logic
KPI and YoY comparison measures
Structured analytical model
Sample data for immediate exploration
Fully customizable for your own business data